


by Craig Love, on August 10, 2023
AI Fueled Exuberance Leads Market Rally
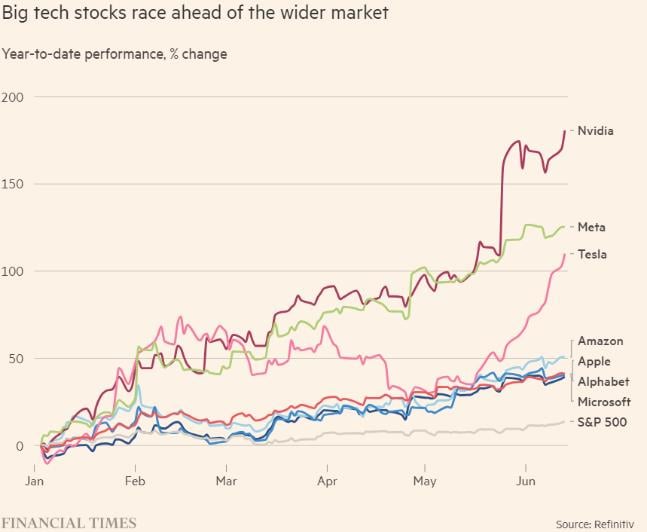
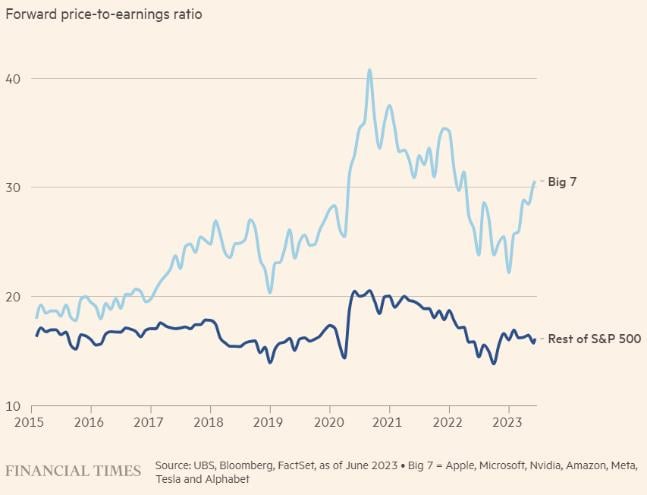
The equity market in the first half of 2023 was dominated by 7 stocks that were all mega-cap technology stocks. These 7 stocks drove the market-cap weighted, S&P 500 up 16.38% while the equal-weighted S&P 500 was up 6.10%. The Russell 1000 Growth Index outperformed the Russell 1000 Value Index by 25.31%. The main driver of this performance was multiple expansions versus an increase in actual or estimated earnings per share. The S&P 500’s average price-to-earnings ratio expanded 14%. This multiple expansion was also heavily concentrated amongst the “Big 7” mega-cap tech stocks (see first graph). This multiple expansion is mostly attributed to the emergence of generative AI and the potential future earnings that these technology companies could earn from incorporating AI into their existing products and services. There is no doubt that AI will help all companies improve productivity in the future and companies such as Nvidia, Meta, and Microsoft will play a large part in bringing AI-based products and services to the economy.
For example, the Brookmont investment team expects AI to help increase Microsoft’s Core Azure revenue growth by 2% - 6% by 2026. The potential applications of AI are numerous and ever-expanding. Microsoft is well-poised to tap into these burgeoning opportunities, particularly given its extensive and devoted user base. By incorporating AI capabilities into its flagship productivity suite (Microsoft Office), the company could bring about a revolution in platform engagement and significantly boost productivity. Moreover, this move could not only result in an increase in per-customer revenue but could also further enhance Microsoft's competitive advantage. Through smart integration of AI services into its existing platforms, Microsoft stands to consolidate its market position, adding to its already robust competitive moat.
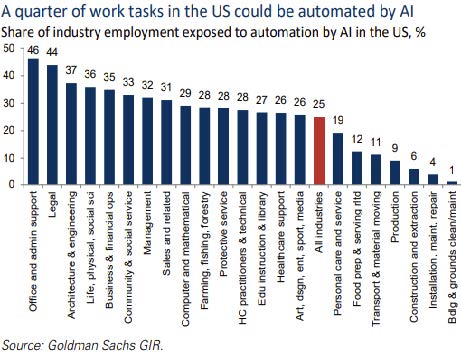
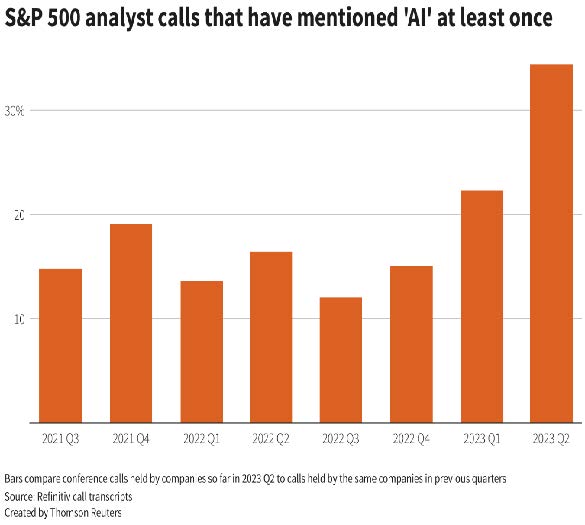
Another bullish sign for the broader market is the expectation from many sectors that AI will transform their business eventually leading to increased EPS. McKinsey expects generative AI to add $6.1 trillion to $7.9 trillion annually in total economic benefits when applied across industries (including new use cases and increased labor productivity), substantially boosting its previously estimated economic value of $11.0 trillion to $17.7 trillion from non generative AI and analytics. By some estimates, a quarter of work tasks could be automated by AI alleviating negative labor force demographic trends. S&P 500 companies mentioning AI in their calls leaped from 15% at the end of last year to nearly 40% in the second quarter of 2023.
More than AI Driving the Enthusiasm
The Mega Cap Technology stocks drove the performance in equity markets but there were several other factors that prevented the US from slipping into a recession after nearly 400 bps of rate increases since early 2022. The resolution of the negative supply shocks from COVID and the Russia-Ukraine War has provided some economic lift to the world economy. Specifically in the US, investments in industrial structures have led to manufacturing and non-residential output surpassing consensus estimates. Manufacturing spending focusing on computer, electronic, and electrical infrastructure has increased 235% in the past 12 months through May and other manufacturing spending has been up 7%. This higher level of infrastructure spending has helped insulate the US Economy from the dragging effects of interest rate increases. Businesses have had time to prepare for a period of economic slowdown which makes the effect of the slowdown less intense and leads us to believe that a soft landing could be possible.
Consumption and jobs are slowing and core inflation is sticky
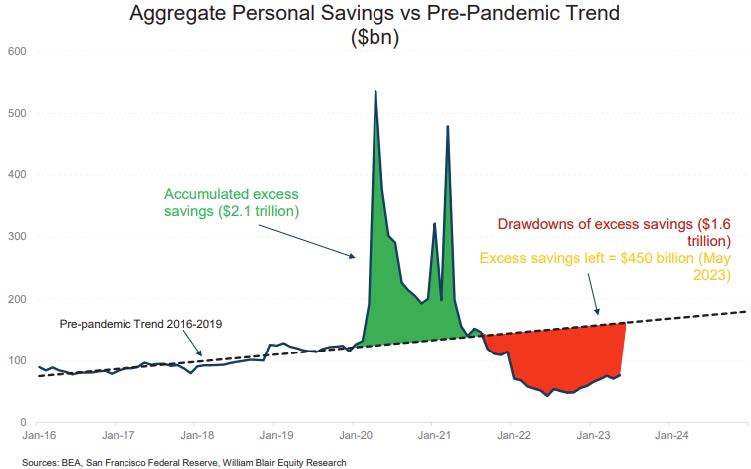
Consumer spending was already subdued and may continue to decline as consumers continue to deplete their pandemic excess cash buffers. These cash buffers are expected to last only until year-end or early 2024, which should lead to more normalized spending activities. Despite this consumer confidence remains robust supported by the strong but softening labor market. The Conference Board Consumer Confidence Index of 117.0 reached its 2-Year high in July.
After nearly three years of forbearance borrowers brace themselves to resume federal student loan payments in October. Consumers burdened with student loans typically face average monthly repayments of approximately $400. This could create a headwind of up to $6 billion per month, potentially reducing discretionary consumer spending by 1% to 2%. We expect a substantial portion of this headwind to be absorbed by luxury-oriented, discretionary purchases in the soft goods category, including clothing and footwear brands. Meanwhile, hard goods such as furniture and appliances, due to their durability and essential functionality, are less likely to be impacted. Therefore, under the current market conditions, hard goods retailers like Home Depot and Lowe's are better positioned to outperform the sector. For instance, around 100,000 appliances break down daily which require replacements. Additionally, in the medium term, two key catalysts could further boost the home improvement sector: 1) Approximately 50% of US homes are over 41 years old, marking the highest level since World War II. 2) Home equity levels are at record highs, and with house prices appreciating, homeowners are likely to invest more in home improvements. As per Education Data Initiative, nearly half of the people that have or had student loans had already delayed their home purchase before buying. Although borrowers aged between 30 and 44 years are responsible for ~49% of the national student loan debt, they constitute only about 22% of the total homeowners in the US. Therefore, these factors could further fuel spending within the housing and home improvement sector.
The high-quality companies that we select to invest in have forward-thinking management teams and are well-situated to capitalize on the increased velocity of innovation that AI will bring to the economy. Additionally, they have significant cash reserves and easy access to credit, allowing them to invest organically in operations and take advantage during recessionary periods to capture additional market share. The likelihood of a potential recession and hiking cycle reversal should make quality dividend growers more attractive relative to other options.
Disclosures
This letter may contain "forward-looking statements" which are based on Brookmont’s beliefs, as well as on a number of assumptions concerning future events, based on information currently available to Brookmont. Current and prospective clients are cautioned not to put undue reliance on such forward-looking statements, which are not a guarantee of future performance, and are subject to a number of uncertainties and other factors, many of which are outside Brookmont’s control, and which could cause actual results to differ materially from such statements. All expressions of opinions are subject to change without notice.
Brookmont Capital Management is a registered investment advisor that invests in domestic and global securities.
Brookmont Capital is defined as an independent investment management firm that is not affiliated with any parent organizations.
A complete description of Brookmont's performance calculation methodology, including a complete list of each security that contributed to the performance of this Brookmont portfolio is available upon request.
Certain economic and market information contained herein has been obtained from published sources prepared by other parties, which in certain cases has not been updated through the date of the distribution of this letter. While such sources are believed to be reliable for the purposes used herein, Brookmont does not assume any responsibility for the accuracy or completeness of such information.
These individual securities do not represent all of the securities purchased, sold, or recommended for this Brookmont portfolio and the reader should not assume that investments in the securities identified and discussed were or will be profitable.
The Brookmont Dividend Growth Strategy returns are based on an asset-weighted composite of discretionary accounts that include 100% of the recommended holdings. Individual accounts will have varying returns, including those invested in the Strategy. The reasons for this include 1) the period of time in which the accounts are active, 2) the timing of contributions and withdrawals, 3) the account size, and 4) holding other securities that are not included in the Strategy. Dividends and capital gains are not reinvested. The Strategy does not utilize leverage or derivatives. Returns are based on U.S. dollars. The inception of the Strategy is January 1, 2008.
The Brookmont Dividend Growth Strategy Composite contains fully discretionary accounts with similar value equity investment strategies and objectives. For comparison purposes, the Dividend Growth Strategy Composite is measured against the Russell 1000 Value Index. The Russell 1000 Value Index measures the performance of the large-cap segment of the U.S. equity universe. It includes those Russell 1000 companies with lower price-to-book ratios and lower expected growth values. The Russell 1000 Value Index is constructed to provide a comprehensive and unbiased barometer for the large-cap value segment. There is no representation that this index is an appropriate benchmark for such a comparison. You cannot invest directly in an index, which also does not take into account trading commissions and costs. The volatility of this index may be materially different from the performance of the strategy.
Brookmont's returns do include reinvestment of dividends and are shown gross-of-fees. All transaction costs are included. The Russell 1000 Value cumulative return includes reinvestment of dividends and capital gains. During a rising market, not reinvesting dividends could have a negative effect on cumulative returns.
Gross returns will be reduced by investment advisory fees and other expenses that may be incurred in the management of the account. Net-of-fees performance was calculated using actual management fees. Additional information regarding the policies for calculating and reporting returns is available upon request.
Your account returns might vary from the composites returns if you own securities that are not included in the Strategy or if your portfolio dollar-cost averaged into the Strategy during the reporting period.
The firm maintains a complete list and description of composites, which is available upon request. Results are based on fully discretionary accounts under management, including those accounts no longer with the firm. The composite policy requires the temporary removal of any portfolio incurring a client-initiated significant cash inflow or outflow of at least 15% of portfolio assets. The temporary removal of such an account occurs at the beginning of the month in which the significant cash flow occurs and the account re-enters the composite at the beginning of the month which follows the cash flow by at least 30 days. Additional information regarding the treatment of significant cash flows is available upon request.
Brookmont Capital Management claims compliance with the Global Investment Performance Standards (GIPS®). To receive a complete list and description of Brookmont's composites and a presentation that adheres to GIPS standards, please contact Suzie Begando at 214-953-0190 or write Brookmont Capital Management, 5950 Berkshire Lane, Suite 1420, Dallas, TX 75225.
The Brookmont Dividend Growth Strategy is available through several institutional platforms and registered investment advisors that are not affiliated with Brookmont Capital Management. Required minimum investments and advisory fees differ from one firm to another.
Brookmont Capital does not provide comprehensive portfolio management services for investors who have not signed an Investment Management Agreement with our firm.
Past performance is not indicative of future results.