Kensington Analytics - Commentary
by Craig Love, on February 25, 2021
At a time when equity valuations are within striking distance of record highs, accompanied by pockets of investor euphoria, there is growing concern the recent rise in interest rates could pose a threat to the ongoing bull market in stocks and high-yield bonds. The yield on the benchmark 10-year Treasury Note has climbed to a one year high of 1.36%, up more than 4x from its all time low of 0.32% in March 2020. Although this rate is still historically low, the rapid pace of the rise is causing concern and many observers are warning markets are increasingly vulnerable to a pullback.
There is no doubt the Federal Reserve is committed to maintaining low rates so long as inflation remains below its target rate of 2%. With the current inflation rate at 1.4%, the Fed has compelling justification to adhere to its easy money policy. Moreover, the COVID pandemic continues to be a significant drag on the economy. Until business activity fully normalizes, there is little chance of a reversal in Fed policy. Consequently, any serious weakness in equities is unlikely, with the caveat a normal 5 - 10% correction could happen at any time.
Bear in mind it is typical for rates to rise in the early stage of an economic recovery. The demand for money increases in response to expanding economic activity. Greater economic activity, in turn, produces greater profits. Ultimately, higher profits generate higher equity and high-yield bond prices even in the face of rising rates, at least for awhile. That leads to the question, “When are valuations too high and how high do rates have to move to suggest a change in the upward trend in asset prices?”
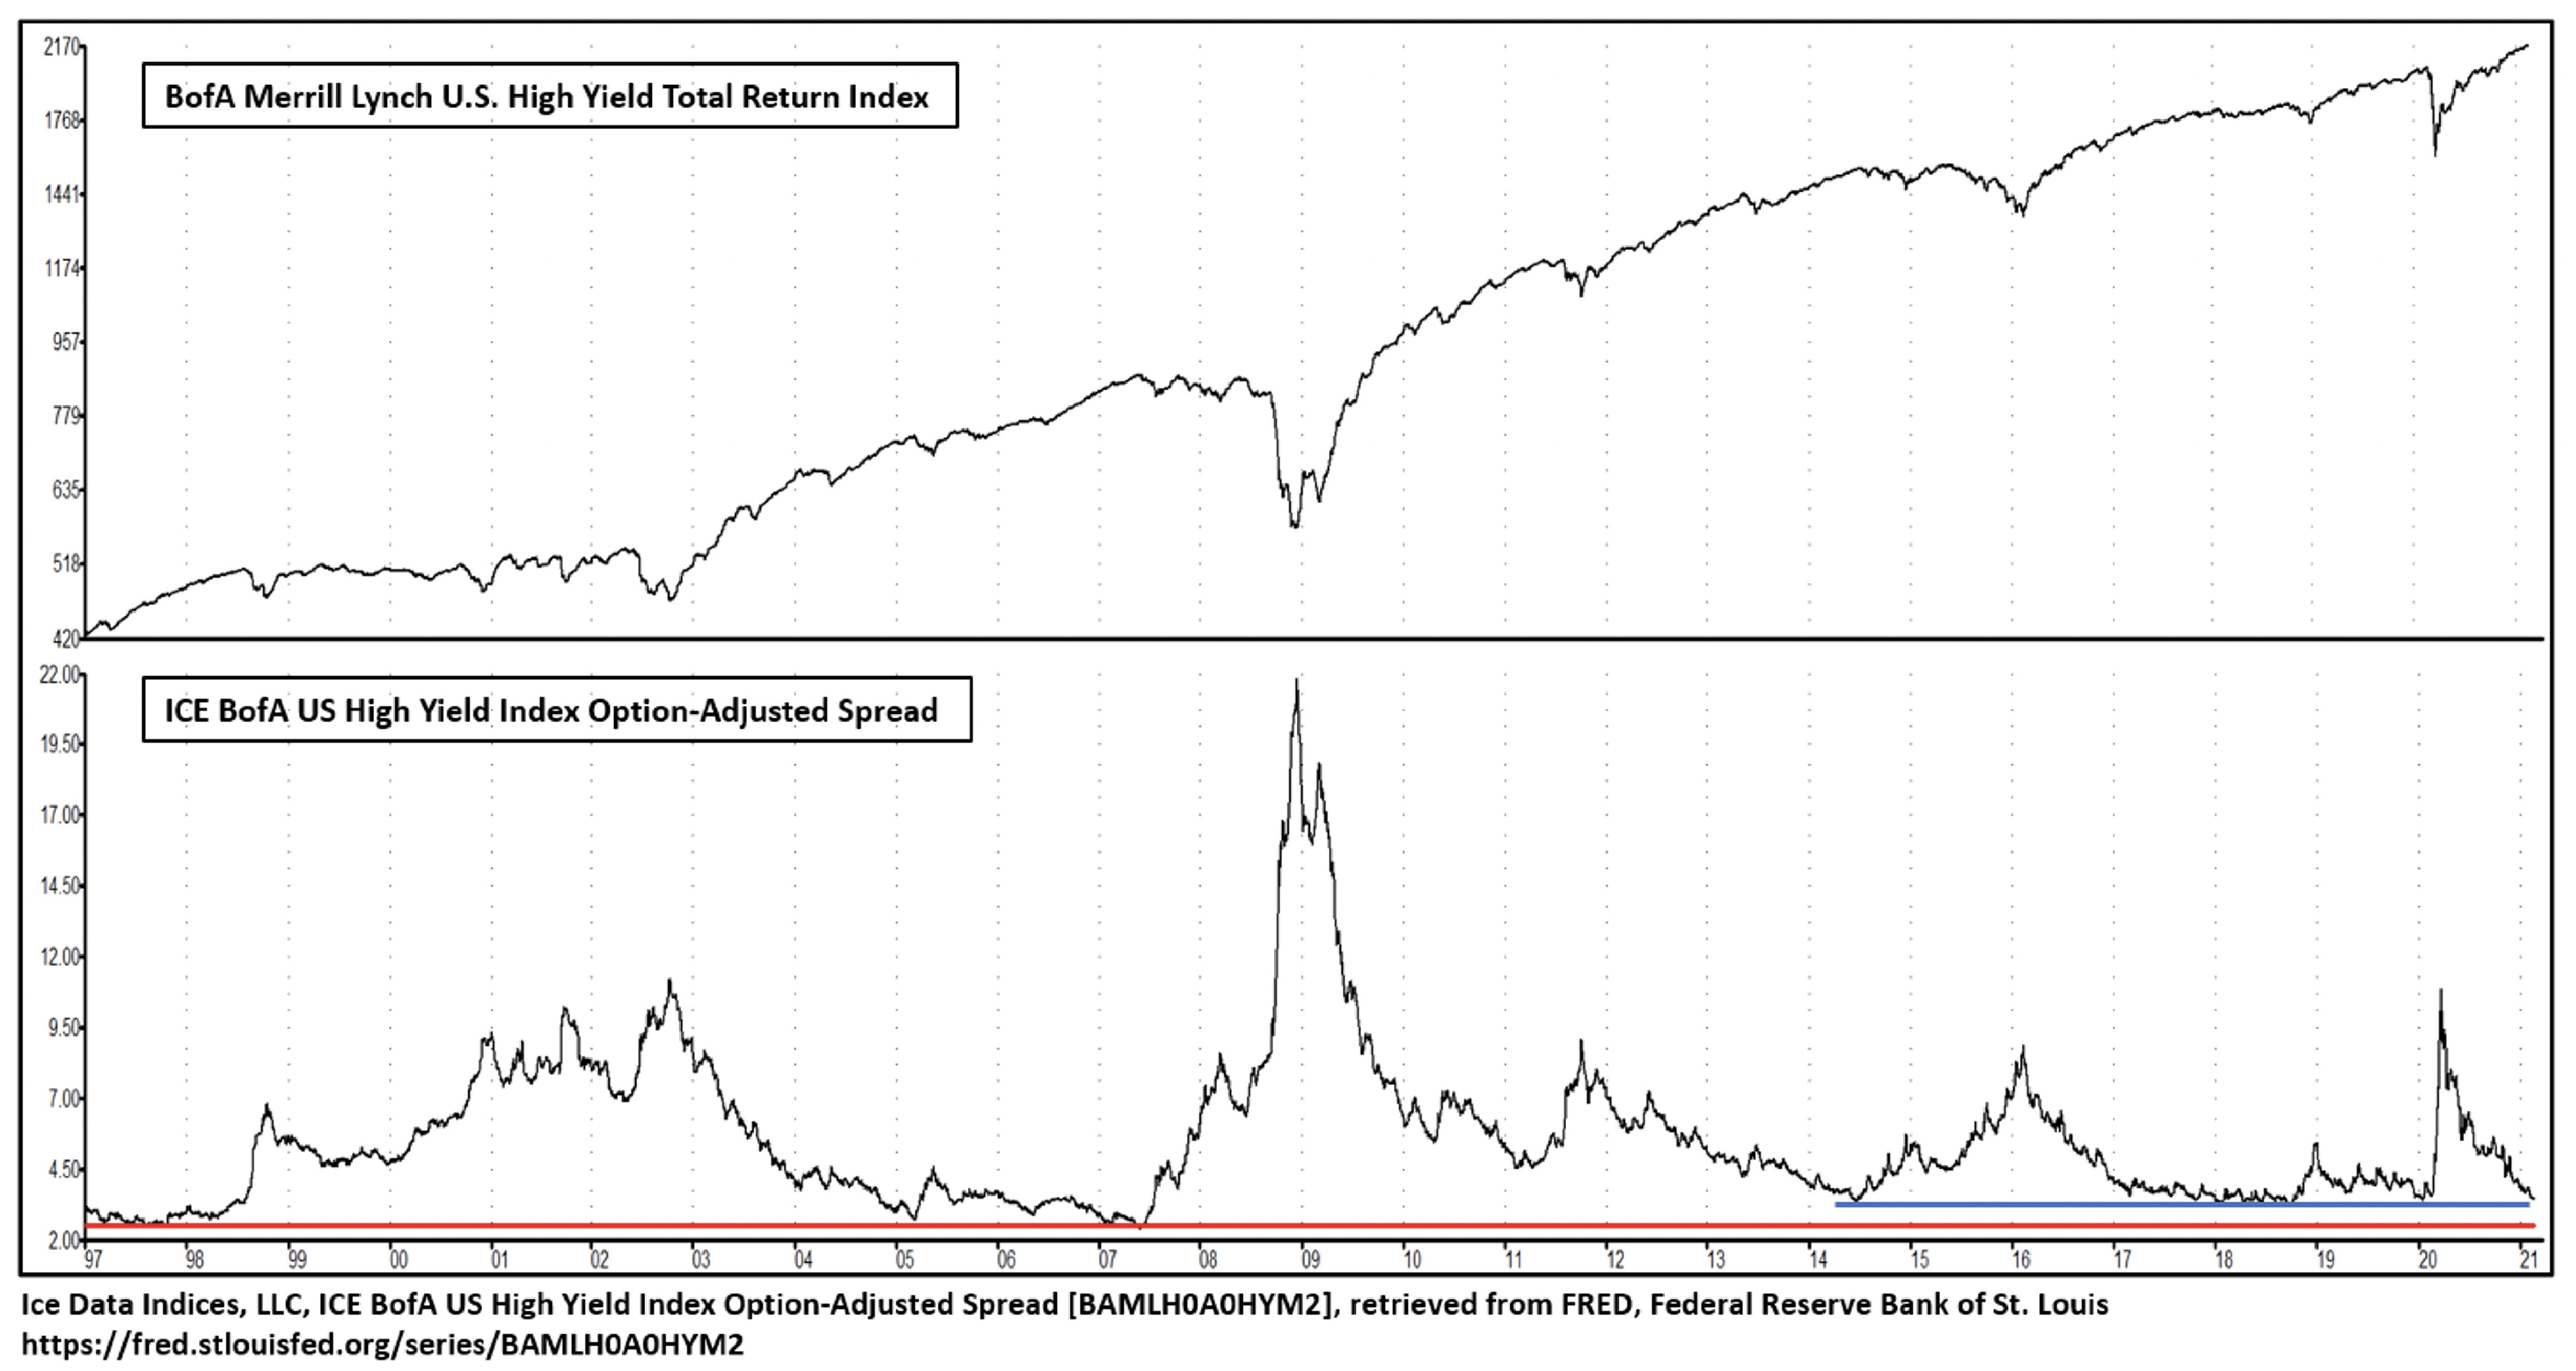
To help answer that question, it is informative to review the history of a widely followed valuation metric, the ICE BofA US High Yield Index Option-Adjusted Spread. The Spread, defined as the relationship between U.S. Treasury and high-yield bond interest rates, is pictured in the lower chart. The upper chart shows the performance of the BofA Merrill Lynch U.S. High Yield Total Return Index.

The basic premise of the relationship is when the difference (or spread) between Treasury and high-yield rates is historically narrow, it’s an indication yield seeking investors have become careless and complacent, ignoring the risk these lower grade bonds carry. Expressed another way, a narrow option-adjusted spread suggests investor sentiment has become overly bullish with markets more likely to be overvalued and susceptible to a correction.
When comparing the two charts, one can see each time since 2014, when the spread touched the blue horizontal line on the bottom right of the lower chart, weakness in the high-yield chart above eventually followed. The current reading of just under 3.5 is approaching that line. It’s also important to note that looking back further in time to 1997 the spread can get even narrower at extremes. Readings of approximately 2.5 as indicated by the red horizontal line occurred in 1997, 2005 and 2007.
So, while monitoring the high yield option adjusted spread as a measure of investor sentiment is worthwhile, it carries the same drawbacks typical of other sentiment-based indicators. Levels of overbought and oversold can vary and lead times before a change in trend takes place can range from weeks to months. These shortcomings are why none of Kensington’s models rely on sentiment as an input. When we build our models, we carefully screen for indicator components that have historically exhibited much greater precision and sensitivity to important turning points in price.
In summary, despite the contraction in the option-adjusted spread due to rapidly rising Treasury rates, our outlook remains constructive for the near term for both high-yield bonds and equities. As our clients know, Kensington’s allocation decisions are driven by our models. Early warning signs in the form of rising rates and narrow spreads are worth attention, but we will continue to rely on our models as our risk management guide.
Best regards,
Bruce P. DeLaurentis
Source: Kensington Analytics


