Kensington Asset Management
by Craig Love, on September 19, 2022
Monthly Market Commentary: August 2022 in Review
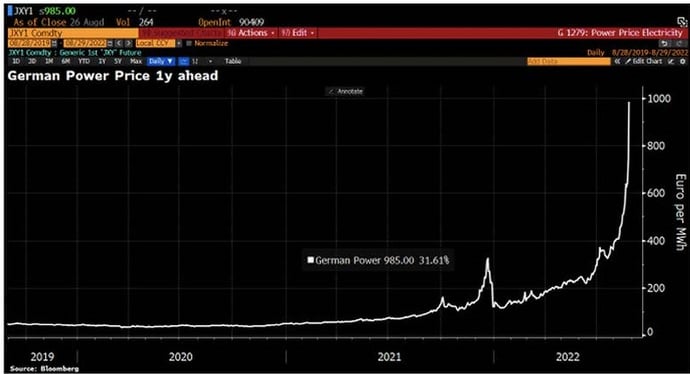
Geopolitics: Tensions between Russia and the West ratcheted up significantly in August as Russia completely shut down the Nord Stream 1 pipeline and gas to the EU, declaring it would resume flows only if the West rescinded its sanctions, something that won’t happen until Russia ends its aggression in the Ukraine. The supply cutoff has forced the EU to quickly scramble for alternate sources of supply which is, in turn, driving up power prices to stratospheric levels (see chart of one year forward German power prices below).
Current storage levels are sufficient to meet demand for the next two months, but that’s not the case thereafter and governments are warning citizens they may be forced to reduce consumption. Businesses are already feeling the pain of higher energy costs which in some cases threaten their very viability. To offset price hikes, EU governments are planning to cap gas prices and provide temporary subsidies in the increasingly dim hopes a ceasefire can be arranged in the meantime.
The energy crisis in Europe and its attendant negative impact on the continent’s economies has put substantial pressure on the Euro, which has traded below dollar parity for the first time since the bear market of 2000 - 2002. The dollar strength is not just in relation to the EU. Other major currencies are also hitting multi-year lows, including the Chinese Yuan, Japanese Yen and UK Pound. Because most global commerce is transacted in dollars, its strength puts increasing pressure on non-dollar countries’ economies who have no choice but to exchange their depreciating currency for appreciating dollars. As their dollar reserves shrink to fund critical items such as energy and foodstuffs, these economies can find themselves increasingly at risk of a currency run such as occurred in 1997 beginning with the Thai Baht.
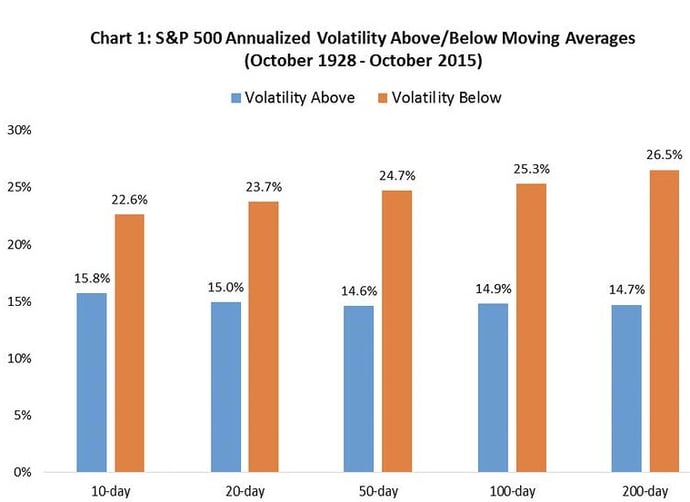
Stock Market: The stock market experienced a volatile month in August, initially advancing on hopes the Fed might pivot away from its hawkish stance, only to have Chairman Powell squelch such optimism in a bluntly worded Jackson Hole speech. Following the speech, the large cap S&P 500 index partially retraced its 19% rally off the June low and ended the month down -4.07% (Small caps fared better, the Nasdaq 100 a bit worse, down -5.22%.) Technicians noted the S&P 500 touched the 200-day moving average during the month before reversing, classic bear market behavior. Market participants pay close attention to moving averages for good reason: historically when markets are trading below popular moving averages, they exhibit substantially more volatility as seen below:
 Source: @gameoftrades
Adding to the bearish backdrop is how rapid the market retraced its gains from the August highs. According to Evercore ISI, since 1950 there have been four times when the market has rallied 50% off a temporary bear market bottom (as it did in the rally off the June lows) only to then retrace 50% of those gains. In each case, the whipsaw was a sign the bear market still had further to go.
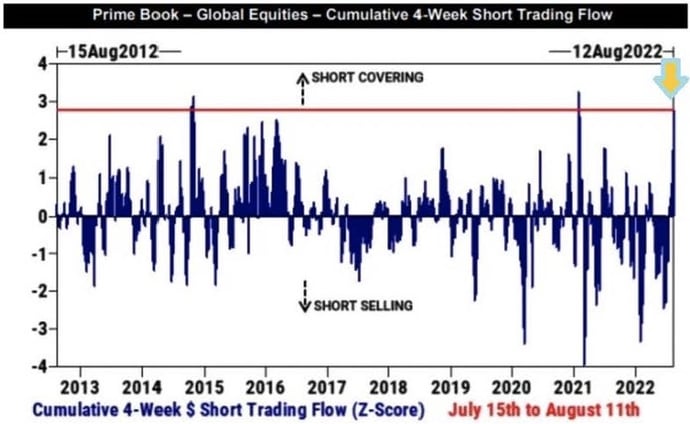
Markets can be especially prone to wide swings in prices during summer when liquidity is low and many traders are on vacation. The increasing prevalence of systematic-based trading and option strategies tend to accentuate these swings in illiquid markets. And, of course, offside investor positioning can play a major role – the snap back rally in August was largely spurred by short covering as seen in the chart below. Going forward, this volatility is likely to continue, at least until investors can gain a firmer handle on both inflation and earnings growth.
 Source: Goldman Sachs
Bond Market: In August, all major fixed income indices fell in price, with corporate bonds leading the way, down -2.93% (Bloomberg Corporate Bond Index). U.S. Treasuries dropped -2.48% (Bloomberg U.S. Treasury Index), while the corporate high-yield index lost -2.30% (Bloomberg High Yield Index). We have pointed out in prior commentaries how elevated bond market volatility has been in 2022 compared to years past and how wide swings in bond prices can often be a precursor to volatility in the stock market. At the beginning of August, the 10-year benchmark yield sat at 2.64%. By month’s end the yield had risen to 3.13%, a swing of 49 basis points.
Factors that have put downward pressure on fixed-income securities include the Fed’s quantitative tightening program which is set to double this month from $47.5 billion to $95 billion. Additionally, there was selling by countries such as China and Russia to reduce their direct exposure to the West and avoid imposition of additional sanctions. And, as mentioned above, the intense global demand for dollars is forcing nations to liquidate their Treasury holdings.
At the same time, the Fed is forcefully pushing up short-term rates, with another 75-basis point hike in the Fed Funds rate expected in September. The two-year Treasury, often seen as a prognosticator of future Fed policy, finished the month at 3.45%, up 55 basis points. The 2-10 Treasury spread, used as the main indicator of the steepness of the yield curve, further inverted to the tune of 32 basis points.
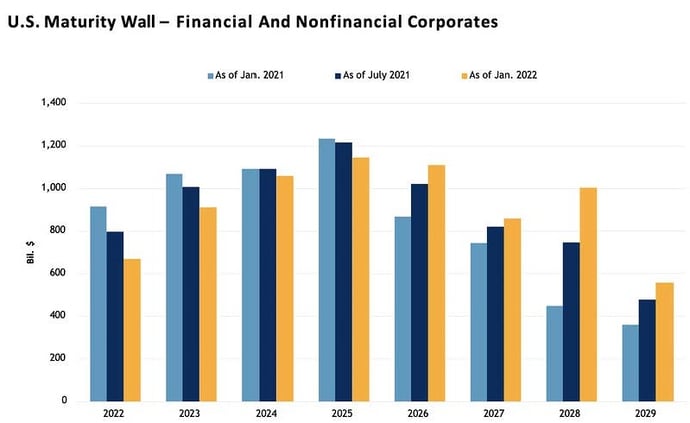
Many observers point to an inverted spread as a foreboding signal of a recession to come and while historically it has been a useful, albeit, imprecise tool in this respect, its greater import lies in its impact on overall bond demand and the financial system as a whole. There is $8T in outstanding corporate debt, of which $3T is high-yield. Of that amount, approximately $1T is likely to mature in each of the next two years and will need to be refinanced, as shown in the graph below. That supply, plus newly issued obligations, amounts to $1.5 – $7.0T, roughly speaking.¹
 Includes bonds, loans, and revolving credit facilities that are rated by S&P Global Ratings
on the respective reporting date. Source: S&P Global Ratings Research
What many investors are unaware of is a significant percentage of the demand for those bonds comes from borrowed money. Institutions employ leverage as a matter of course in order to generate higher returns, effectively increasing total demand for bonds. Since the majority of time the yield curve is positively sloped (long-term rates exceed short-term rates), this strategy is performance additive. However, when the curve inverts and the cost of short-term borrowing rises to a point where it makes it uneconomic to use leverage, the resulting reduction in total bond demand can become problematic. While so far in 2022 the curve inversion has not been so extreme to disrupt demand (and therefore companies’ abilities to fund their operations), it is important to monitor bond issuance for signs of stress in this regard.
Monetary Policy and the Federal Reserve: In a brief and unusually blunt Jackson Hole address, Chairman Powell made it clear how intent he and the other members of the FOMC are in bringing inflation down to its long-term policy objective of 2 - 3%. Perhaps the most notable part of his speech was the following: “While higher interest rates, slower growth, and softer labor market conditions will bring down inflation, they will also bring some pain to households and businesses.” Federal Reserve chairmen are not known for speaking with such directness, which may have had something to do with Powell’s unhappiness over the market’s rather complacent view of future monetary policy and more personally, his resolve in fighting inflation. It was clear the Chairman wanted to send a strong message that a dovish pivot was not in the cards and policy makers were prepared to do what it takes to restore price stability.
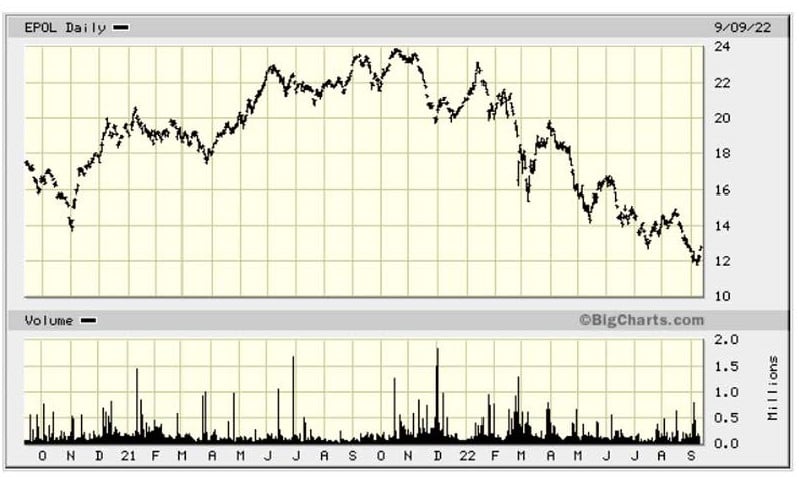
The Federal Reserve and most every global central bank has a difficult task ahead. The underlying sources of inflation have as much to do with global supply issues as they do with domestic demand. Given that supply issues are subject to a changing and increasingly hostile geopolitical landscape, the tools at the central banks’ disposal will be effective, but only to a degree. The price of natural gas in Europe, for instance, will be far more dependent on Russia’s willingness to keep its gas flowing to those it now considers adversaries. The price of foodstuffs is also much more beholden to such considerations and as well as maritime choke points remaining open. One crude proxy of geopolitical risk is the Poland ETF. As seen in the chart below, it remains in a decided downturn.
 Source: Goldman Sachs
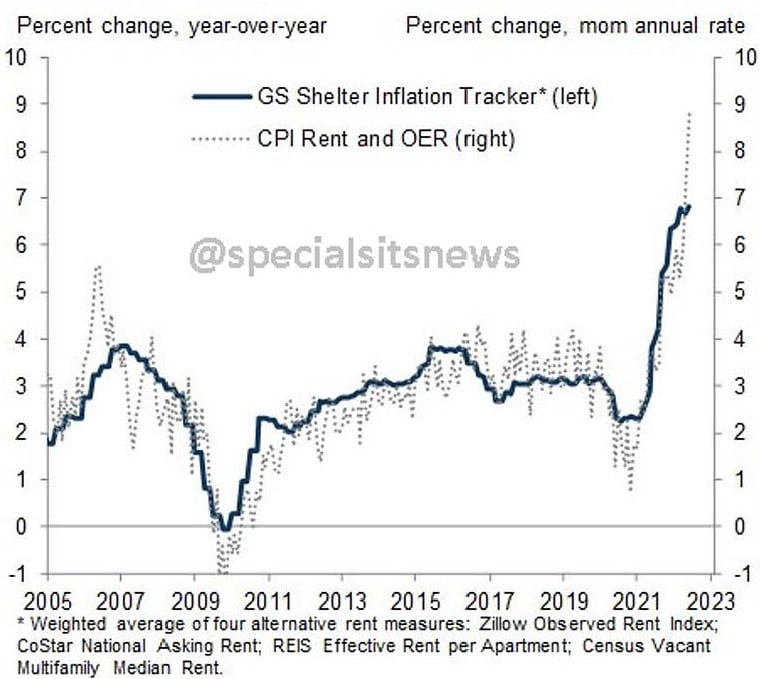
Turning to the U.S. economy, housing has clearly shifted to a downturn. The National Home Builders Housing Index, a measure of single-family builders’ sentiment, fell for the eighth consecutive month and is at its lowest level since May 2020. While this might be viewed as “good” news, as a slowdown in housing should reduce overall inflationary pressures, the irony is the drop in demand and the accompanied slowing in home prices won’t be reflected in the CPI anytime soon. In fact, quite the opposite, as owner equivalent rent (OER), the variable used to measure homeowners’ costs and which makes up ~33% of the CPI, continued to rise month-over-month. Since it’s a lagging indicator, any positive inflation impact from housing, at least as measured by the official indexes, will likely be months away.
Managed Income Strategy: After entering its second Risk-On trade in mid-July, the Managed Income Strategy pivoted back to a Risk-Off posture as we closed out the month of August. High-yield bond spreads, as measured by the ICE BofA US High Yield Index Option-Adjusted Spread, bottomed out at 4.21% on August 11th and widened to over 5% at the end of the month, driving high-yield bond prices lower and the Managed Income Strategy to a defensive position.
Dynamic Growth Strategy: As noted in our August commentary, the Dynamic Growth Strategy entered a Risk-On trade in early July and despite the challenging second half of August, remains Risk-On through the close of August. As discussed above, after the initial gains in August for the S&P 500, the index reverted down almost 10% from the intra-month high, but remains above our entry point level in early July.
Active Advantage Strategy: Our tactical balanced strategy, Active Advantage, rotated to a more defensive portfolio posture at the end of August. Entering the month, the portfolio was positioned in its “base” portfolio, allocated 60% to equities and 40% to fixed income, but risk-pivoted at the end of the month to primarily a Risk-Off posture, exiting its fixed income positions while maintaining a small allocation to equities.
¹ Fil Zucchi, Fil’s Newsletter, The 2-10 Yield Curve Matters (a lot), But Not Because It May Signal A Recession, August 2022
Source: Kensington Asset Management


