


by Craig Love, on October 11, 2022
There is an old Chinese proverb that states, “There are many paths up the mountain,” which simply means there is more than one way to achieve your goals. This is as true with investing as it is in life. At Kensington, we believe employing a data-driven, quantitative investment approach is the most effective way to achieve our goals of generating steady, above-average positive returns with downside protection and low volatility. In this Kensington Brief we will provide an overview of quantitative investing and discuss how Kensington’s quantitative decision models work.
What is Quantitative Investing?
Quantitative investing, also commonly referred to as systematic investing, is an investment approach that uses advanced mathematical computer modeling techniques, rigorous research and data analysis to construct investment portfolios. Quantitative analysis is most commonly contrasted with discretionary analysis. Whereas quantitative strategies rely on computer models, hard data and programmatic algorithms, discretionary investment approaches are built on human interpretation of various data points that are used to make investment decisions. The key difference is that discretionary approaches are perceived as being more subjective whereby investment managers rely upon their expertise and opinions to make informed decisions. Quantitative strategies, on the other hand, are designed to be systematic by relying on mathematical interpretation of data, rather than subjective and emotional decision making. It is, in effect, the difference between a quantitative strategy and qualitative strategy. This is not to say that one approach is better than the other. They are simply different, each with their own strengths and weaknesses, and may even be utilized in conjunction with each other as part of an overall investment management approach.
One common misconception of a quantitative approach is that an investment manager uses a “black box,” with high frequency trades being spit out by a completely autonomous machine without any understanding of the “why or how.” In reality, human intellect is central to quantitative investing, though the primary skill sets may differ from those required by discretionary or fundamental disciplines. All the data and computing power in the world will not generate consistent investment returns on their own. Rather, the quantitative approach is a mathematical and disciplined way to express the investment insights of investment professionals while minimizing human emotion and bias.
Winning by Not Losing
There are many types of quantitative tools and techniques including factor investing, high-frequency trading, statistical arbitrage, risk parity, and AI/Machine learning, to name a few. While there are meaningful differences between them, each is employing varying forms of mathematical processes to inform their buy/sell decisions.
At Kensington we employ a tactical trend-following investment methodology that utilizes a variety of proprietary indicators to identify persistent price trends in our target markets which we use to determine portfolio positioning. When the market trend is perceived to be positive, we shift our portfolios to a Risk-On investment posture, investing broadly in our target sector(s) to take advantage of expected price gains. When the trend is identified as negative, we will pivot to a Risk-Off posture, moving the portfolio defensively to a neutral position, to avoid expected drops in market prices. This ability to pivot is critical to our investment philosophy of “winning by not losing.” If we can avoid significant drawdowns in the market, we believe we can provide a less volatile and consistent investment result over time. We addressed the importance of avoiding drawdowns in our May 2022 Kensington Brief, which can be viewed here.
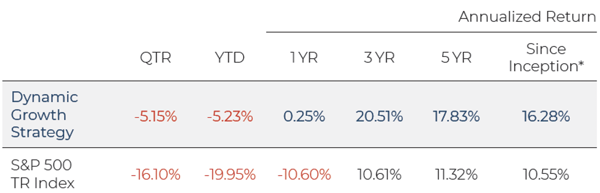
Performance information through June 30, 2022
*Inception Date: December 31, 2014
Past performance is not indicative of future returns and the value of the investments and the income derived from them can go down as well as up. Future returns are not guaranteed and a loss of principal may occur. There is no guarantee any investment strategy will generate a profit or prevent a loss. Investing in securities involves risk, including loss of principal. The risks associated with this Strategy include general market risk, credit risk, interest rate risk or risk of the portfolio not performing as expected. The types of securities held by a comparison benchmark may be substantially different from the investment strategy. The S&P 500 TR Index is a capitalization weighted index of 500 stocks representing all major domestic industry groups. The S&P 500 TR Index assumes the reinvestment of dividends and capital gains. It is not possible to invest in an index, and index returns do not include management fees. Performance figures provided reflect the deduction of a 1.50% annual investment advisory fee. Investment returns will be reduced by advisory fees and other expenses charged in the management of a client’s account.
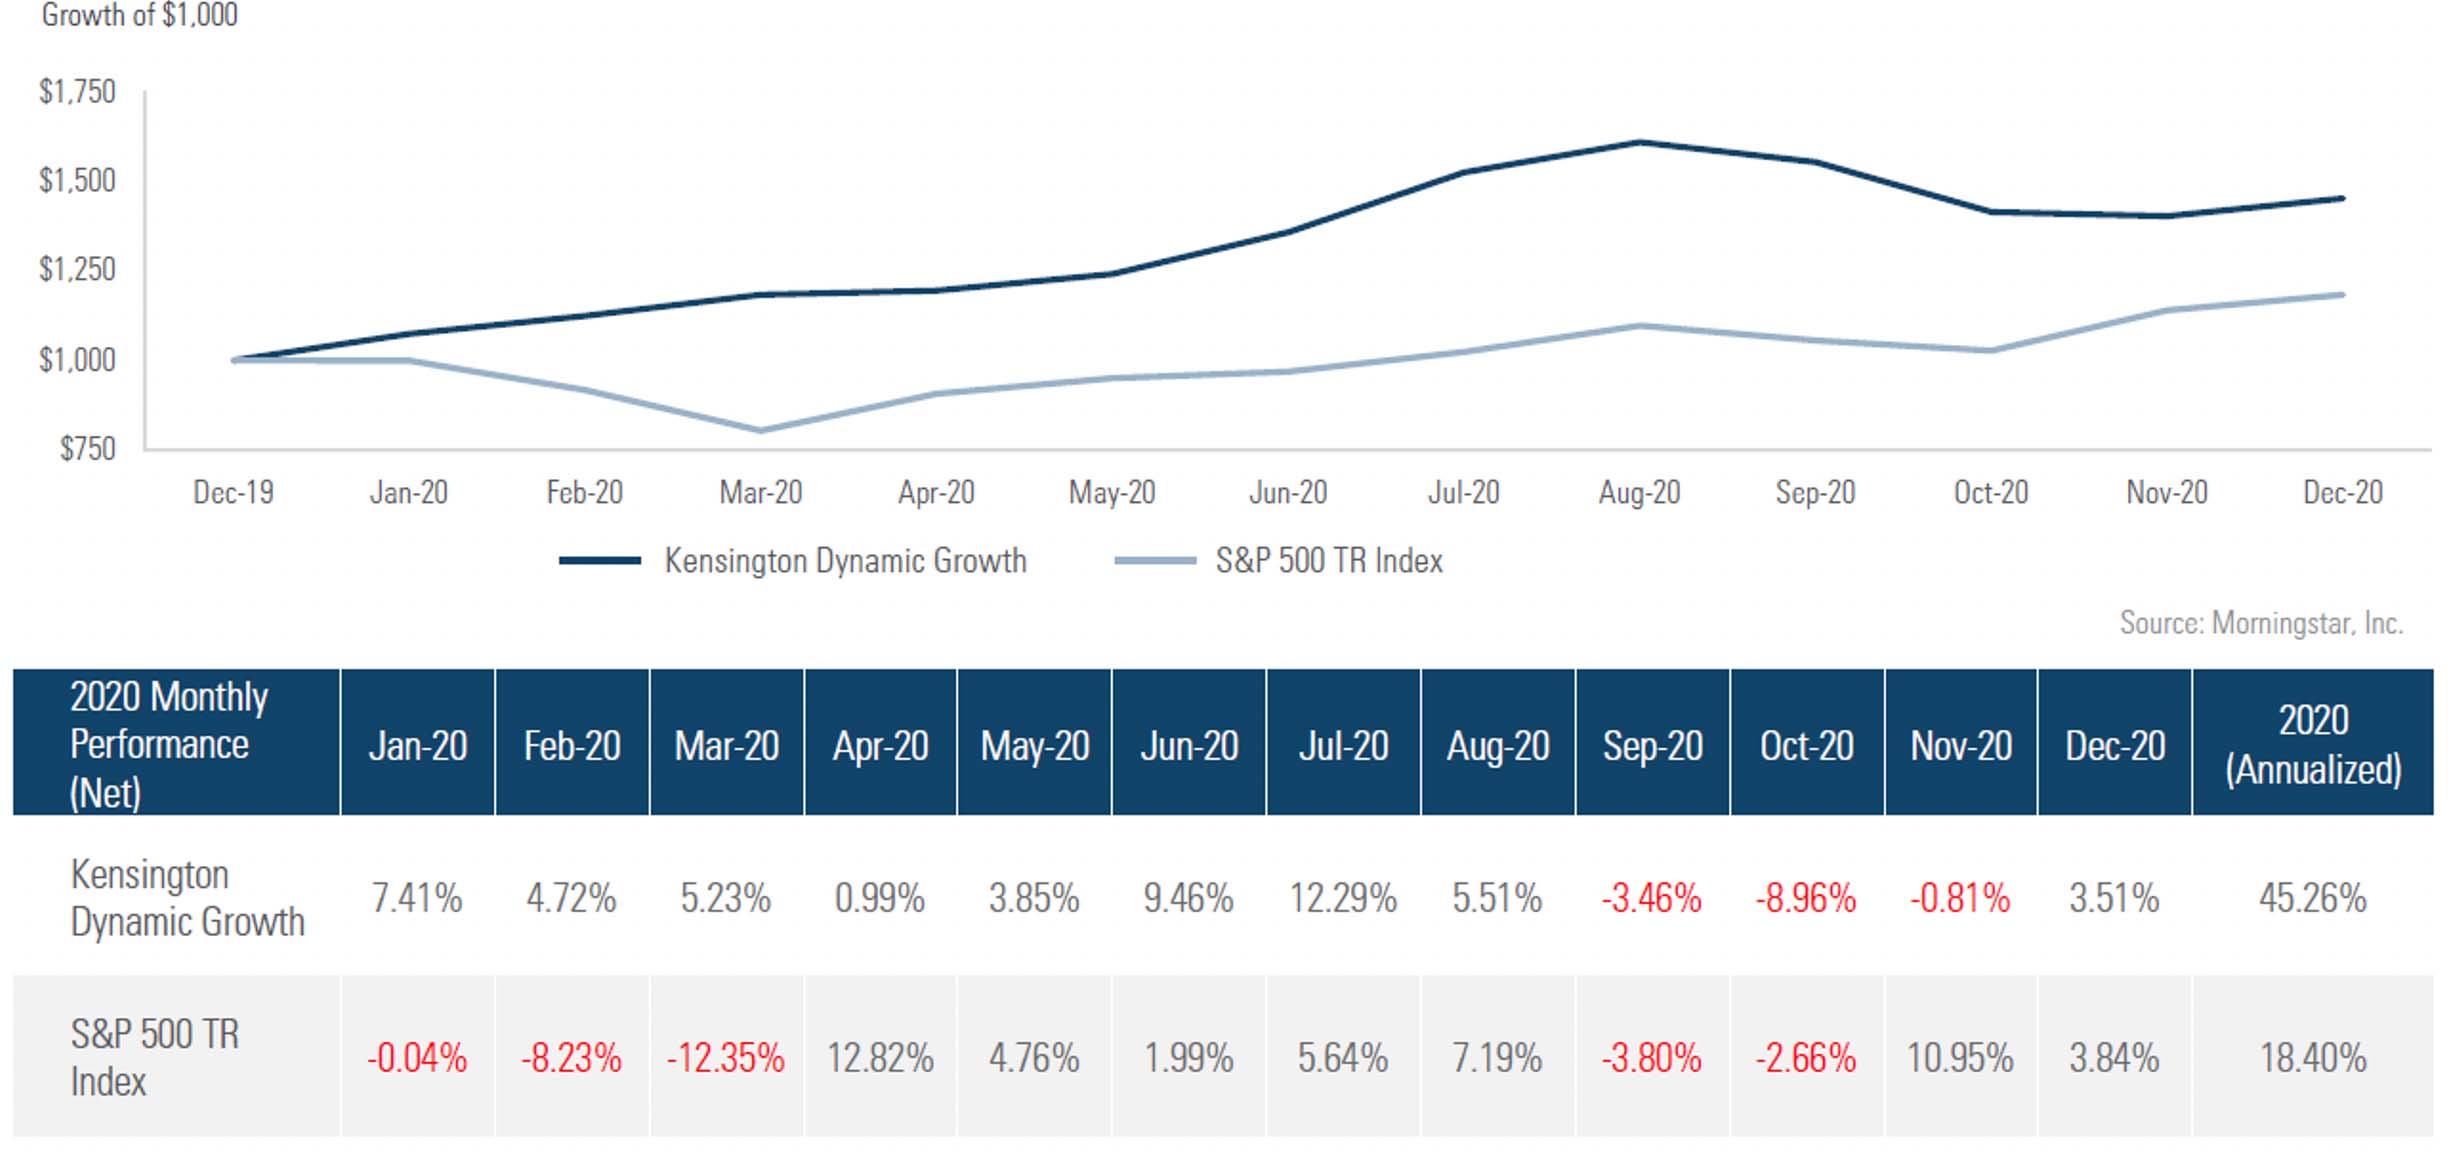
A good real-world example of this was in the Spring of 2020, during the onset of the COVID-19 pandemic. Our Dynamic Growth Strategy identified weakness in the market in mid-February as volatility began to escalate. This was not an assessment of the threat of a global pandemic, but rather an emotionless quantitative assessment of the market environment that guided us to move to a Risk-Off posture.
As you can see from the chart above (Exhibit 1), the Dynamic Growth Strategy was able to avoid the market pullback in February and March 2020 (S&P 500: -20.58%), and even achieve positive returns during that same period (Dynamic Growth: +9.95%) through exposure to Treasury securities as a “flight to quality” occurred. The positive return was a bonus, but the more important aspect of that trade was our ability to avoid the significant decline we would have experienced had we stayed Risk-On. As a result of following our quantitative process we were able to outpace the benchmark by over 25% for the year, despite lagging the benchmark later in the year. This was achieved in no small part by avoiding the significant drawdown the market experienced in the first quarter. That’s the definition of “winning by not losing.”
Kensington’s Quantitative Approach
Trend following strategies are not uncommon and have been employed with varying levels of success for decades. There are several potential risks to trend following strategies, with the most common referred to as a “whipsaw trade,” whereby the price of a security abruptly reverses direction against the prevailing trend, leaving a strategy susceptible to missing out on gains by being out of the market, or suffering losses by being invested as the market turns down. There is a simple reason this occurs. Traditional trend-following strategies rely on an observable trend to develop before investing, but not all trends persist for the same amount of time, and many external factors can influence the direction of the market. This can lead to a strategy getting out of sync with the market direction and suffering losses.
The simple fact is there is no single indicator or group of indicators that can accurately assess every market environment. Low volatility market environments behave very differently than markets with persistently high volatility, and the most effective indicators to assess each of these types of markets may be vastly different. This is where we believe the Kensington approach is unique. At Kensington we employ an “adaptive” investment approach intended to identify and match the “speed of the market” by systematically adjusting model inputs and indicator parameters predicated on the environment prevalent at the time.
Exhibit 2
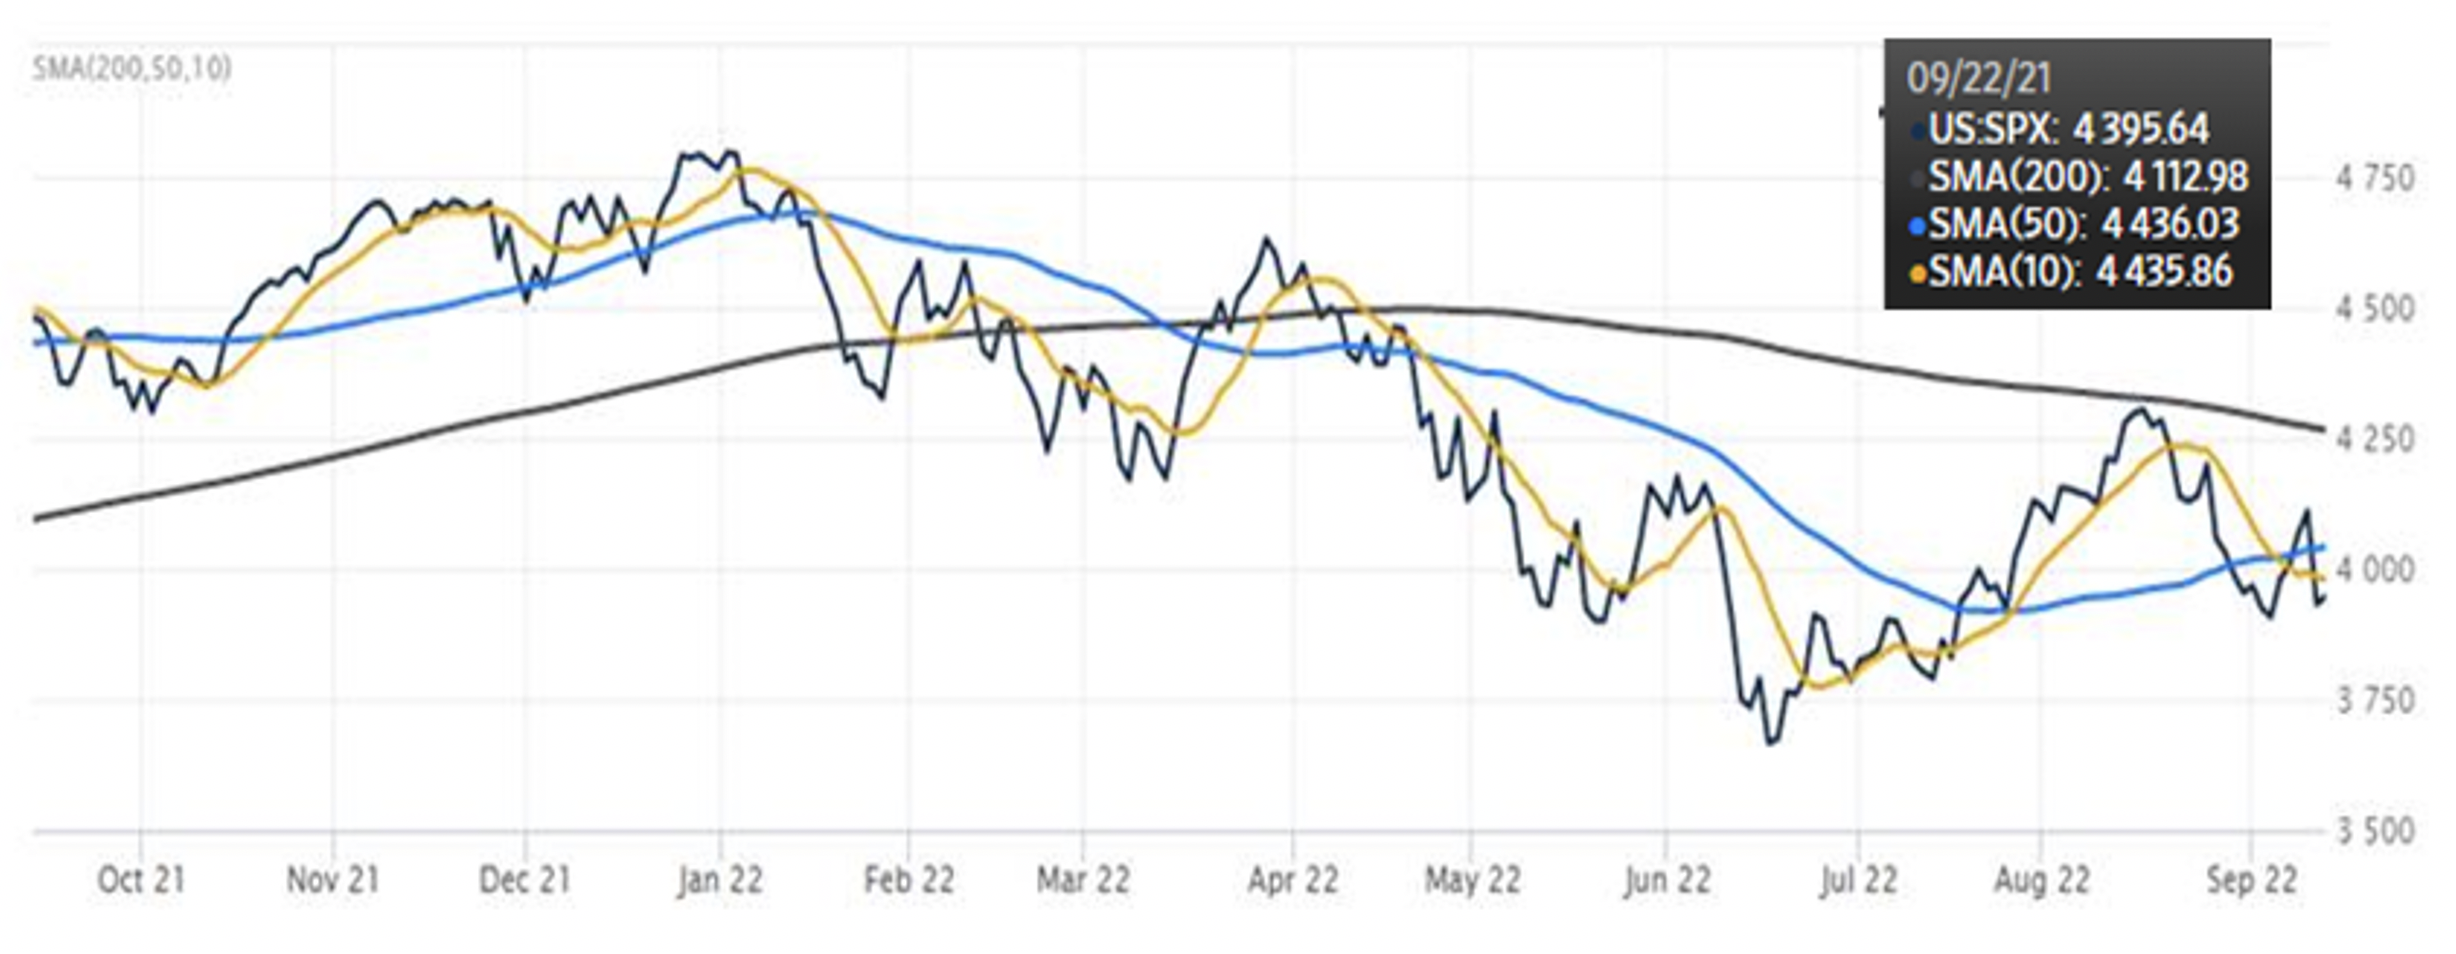
Source: www.wsj.com
A simple way to conceptualize this is through moving averages, a core component of our, and most trend following strategies. The moving average is a quantitative analysis tool that smooths out price data by creating a constantly updated average price in order to assess a trend. The average is taken over a specific period (10 days, 50 days, 200 days, etc.), called a “lookback period.” The chart above (Exhibit 2) demonstrates how varying lookback periods can change the perception of the prevailing current trend. Kensington’s strategies employ a modeling system that seeks to assess the volatility, or speed, of the market and adjust the look back period based on the current market environment. For example, when volatility is elevated, we will shorten the lookback period of the moving average to increase the sensitivity of our response to price movement, and when volatility is subdued and the trend more persistent, we will lengthen the lookback period to desensitize response to price movement. We believe that incorporating an adaptive approach to designing model components is much more effective than a static approach when dealing with fast moving and volatile markets, as is often the case in bear markets that pose elevated risk.
In addition to our adaptive approach, a key component of our system is the use of counter-trend logic, a proprietary quantitative tool used to identify when markets are deemed to be overbought or oversold, which may lead to a quick reversal of the trend in the short-term. By incorporating this method, which assesses not just the change in price level but the speed and magnitude of the change, we can seek to identify turning points in the market before it becomes obvious using more traditional trend-following concepts. This tool is particularly useful in market environments like the current one, where markets are moving more rapidly than historical norms.
That of course is not to say that our, or any, quantitative system is perfect. It can and has been susceptible to whipsaws and other pitfalls of quantitative strategies. October 2020 from Exhibit 1 above is a good example of that. In fact, we expect to have temporary periods of underperformance for our strategies. Whether because we are defensive when the market rises or conversely when we remain Risk-On through periods of turbulence, we won’t get all of them right. That is the nature of the beast, and any system that wins 100% of the time based on back-testing is likely overfitted* to the market and will disappoint in real-world application. However, over full market cycles, we believe we will win more than we lose and are confident we can meet our objectives of limiting volatility, providing downside protection, and delivering above-average positive returns by following our long-term process. There are many paths up the mountain, but we believe the path with the least number of valleys is the fastest one to the top.
* In mathematical modeling, overfitting is "the production of an analysis that corresponds too closely or exactly to a particular set of data and may therefore fail to fit to additional data or predict future observations reliably.”