


by Craig Love, on July 27, 2023
Kensington Market Insights - July 27
Market Insights is a weekly piece in which Kensington’s Portfolio Management team will share interesting and thought-provoking charts that we believe provide insight into markets and the current investment landscape.
Bulls on Parade
As we close out the month of July, the S&P 500 is fast approaching a new all-time high, now trading less than 5% away from its previous high, as of the market close on Wednesday. Up until recently, the 2023 equity market rally has been defined by strong gains from 7 mega-cap stocks, with the rest of the market treading water. That dynamic has recently shifted, however, as participation among S&P 500 members has gradually improved. As you can see from the chart below, we now have 87% of the S&P 500 trading above their 50-day moving average, a number that has been flat to negative for much of the year.
Market Breadth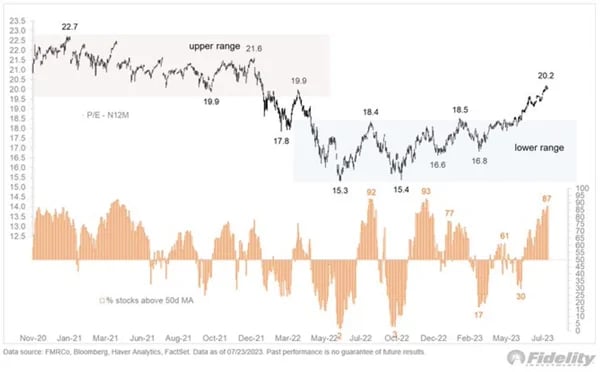
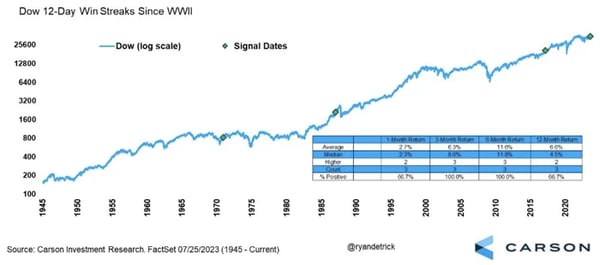
This shift to broader participation is perhaps best demonstrated in the Dow Jones Industrial Average (DJIA), an index made up of a very diverse set of companies with fairly even representation across industries. Through Tuesday, the DJIA had registered gains for 12 consecutive days, something that has occurred only three times since World War 2. As you can see from the chart below in each of the previous instances 3 and 6 months later, the DJIA was higher every single time.
12-Day Win Streaks Tend to Happen in Bull Markets
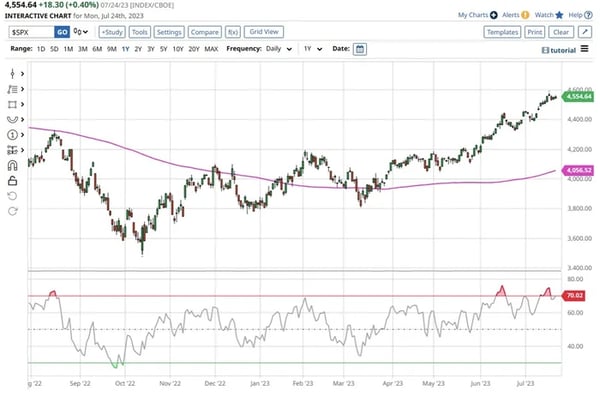
The situation now turns to a question of sustainability. In the face of still increasing interest rates and expanding valuations, are we due for a pullback? After all, the S&P 500 is trading 12.2% above its 200-day moving average (below) and is showing signs of being overbought by the Relative Strength Indicator (RSI), which is currently registering above 70, a commonly viewed threshold for overbought conditions. However, since 1970, 8 of the 12 times the S&P 500 was 12% above its 200-day moving average it ended up trading to 20% higher, indicating there may be room for additional run.
S&P 500 Index ($SPX)
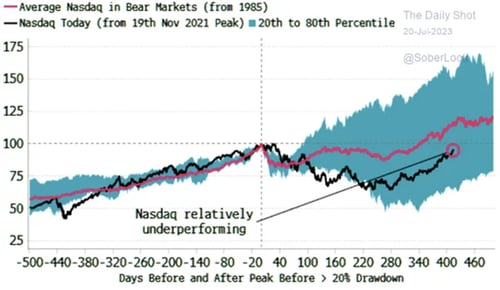
Even the NASDAQ Composite, which has been on a blistering pace so far this year, up more than 35%, may still have further gains ahead if history is any indication. As you can see from the chart below, the NASDAQ is still lagging the average bear market recovery for the index dating back to 1985.
Nasdaq Still Lagging Average Bear Market Recovery
Source: Bloomberg
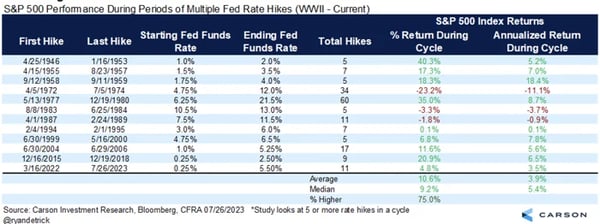
While it may seem counterintuitive, there is actually a history of equity markets rallying during Fed rate hike cycles. As you can see below, dating back to 1946, the S&P 500 has averaged a 10.6% return during multiple rate hike cycles. During the current cycle, the index is only up 4.8%, just over half the historical mean.
Stocks Again Gained While the Fed Hiked
Of course, nothing is guaranteed. We are still faced with significant fundamental headwinds including a potential reversal in inflation as we pass through the disinflationary base effect, an inverted yield curve, contracting leading economic indicators, and a bankruptcy surge, which have now increased at their fastest pace since 2010 (below).
Bankruptcy Surge
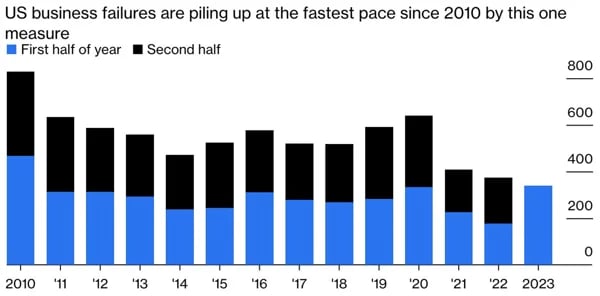 Source: S&P Global Market Intelligence. Note: only includes US companies covered by S&P. This means public companies or private companies with pubic debt with a minimum of $2 million in assets or liabilities at the time of filing, plus private companies with at least $10 million in assets or liabilities.
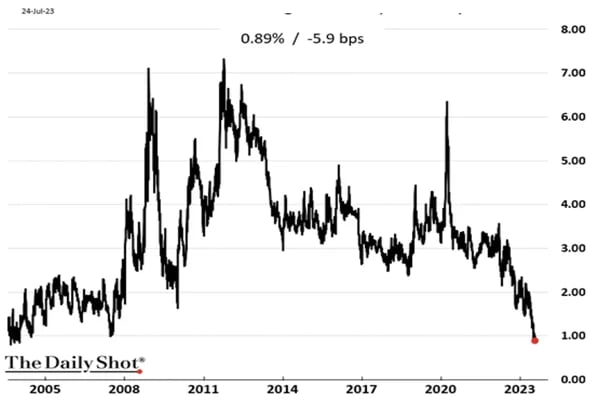
We’ve also seen during this rally the equity risk premium for the S&P 500 hit its lowest level in two decades, which will certainly be a headwind for longer-term returns (below).
S&P 500 Forward Earnings Yield - 10yr Treasury Yield
As always, it now turns to a question of timing. Moving defensively to protect against a potential longer-term pullback can be costly. Moving too slowly, however, can mean erasing early-year gains. The key is to remain nimble. It’s often times like these when a tactical approach is most appropriate for navigating an ever-changing landscape in which longer-term fundamentals are in contrast with shorter-term market movement.
Forward-looking statements are based on management’s then current views and assumptions and, as a result, are subject to certain risks and uncertainties that could cause actual results to differ materially from those projected. This market insight is for informational purposes only and should not be construed as a solicitation to buy or sell, or to invest in any investment product or strategy. Investing involves risk including loss of principal.