


by Craig Love, on January 24, 2023
Monthly Market Commentary: 2022 Year in Review
2022: Year in Review
Geopolitics: 2022 will likely be remembered as the year the international community began to shift from a relatively stable unified world to a more volatile structure, with countries increasingly mapping their own paths outside of the post-World War II monetary framework. Russia’s invasion of the Ukraine, while serving to bring the West together in defense of an ally, has also laid bare countries’ exposure to the West’s financial system.
From a geopolitical point of view, it’s difficult to imagine the West’s adversaries and/or competitors won’t adjust their policies over time to inoculate themselves from such vulnerabilities. This can and has taken the form of reducing the size of Treasury holdings and, equally important, efforts over time to reduce the pre-eminence of the U.S. dollar in global trade.
A prime example is China’s recent agreement to purchase oil and gas from Arab nations in the Gulf. Payments will be made in renminbi, the official currency of China, not dollars, perhaps a telling indication of how some commodities may be traded in the future. Oil purchases have for decades been made in dollars, but this is now changing, and the shift promises to reduce U.S. influence in the Gulf and potentially increase China’s importance and influence over time.
Why would Gulf countries want to take on the risk of being repaid in a relatively illiquid unconvertible currency? The answer lies in renminbi oil futures which have been trading on the Shanghai International Energy Exchange since 2018. Those futures are directly convertible into gold. Thus, Arab countries, which control 40% of the world’s oil reserves, now have the option of being paid in dollars or, effectively, gold. Concern about growing U.S. fiscal deficits would presumably favor payment in the latter.
Stock market: 2022 was (obviously) a difficult year for investors with the S&P 500 finishing the year down -18.11% and the large-cap technology driven Nasdaq 100 falling an alarming -32.38%. The reason for the poor performance isn’t difficult to discern: a Federal Reserve, intent on slowing inflation by putting the brakes on the economy through a series of rapid short-term rate increases. This and the reversal of its quantitative easing program had the effect of removing liquidity from markets and tightening financial conditions. Investors accustomed to easy money and easy gains were ill-prepared, with many having never experienced a rising rate environment of this magnitude. Portfolios reliant on the principles of FOMO/TINA and a “Fed put” were decimated over the course of the year.
Also of note was the shift in dominance between growth and value stocks. As seen in the chart below, the performance delta was startling, with value outperforming by ~2200 basis points.
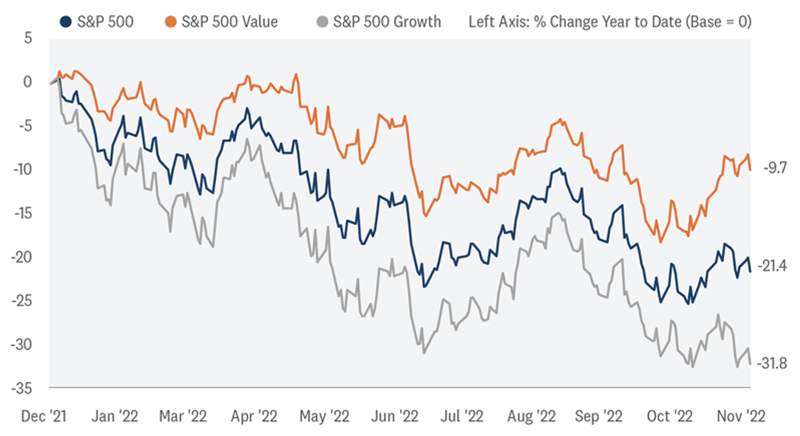
Source: LPL Research, Bloomberg 11/09/2022
Of course, this sector shift shouldn’t come as a surprise as lower P/E stocks and particularly those paying dividends offer greater downside protection when the discount rate applied to those earnings/cash is rising. On the flip side, growth stocks that trade at high multiples are at significant risk, not only from a shrinking of those multiples but lower earnings growth due to the slowing economy and increased borrowing costs. The combination flattened many tech and speculative companies’ stock prices in 2022.
Looking forward, with much of the monetary tightening ostensibly behind us, investors will now be closely watching the outlook for corporate earnings. Whether stock market valuations are rich, fairly valued or even undervalued will depend on future earnings growth.
Bond market: While the drop in value in bonds in 2022 was not as severe in absolute terms as that of stocks, it was perhaps more painful as bonds have historically been the ballast to equities when the latter encounter rough going. That was emphatically not the case last year with the broad U.S. Treasury Index down -12.46% (longer duration Treasuries suffered even more, falling a whopping -29.3%) and other bond indices also down double digits.
The table shows the returns on U.S. bonds in 2022, along with the previous worst performing years on record for those bonds.
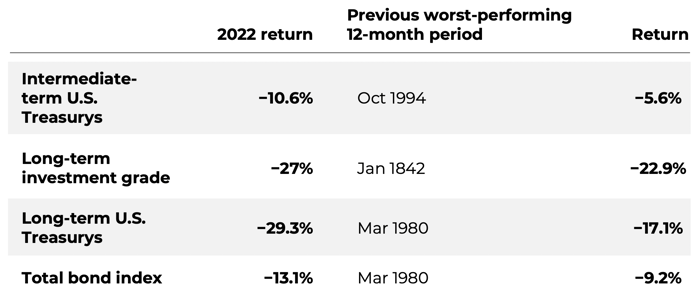
Table: Gabriel Cortes / CNBCSource: Analysis by Edward F. McQuarrie, professor emeritus, Santa Clara University
What were the reasons behind the poor performance of historic proportions? A perfect storm of sorts with historically low interest rates in an era of easy money colliding with the worst bout of inflation in a generation that forced monetary authorities to embark on a series of rate hikes the speed of which hadn’t been seen in decades.
Not surprisingly, the one index in the bond market that performed relatively well in 2022 was bank loans. These securities have adjustable rates and short duration, both of which do well in an environment when rates are rising and the economy is healthy (meaning credit quality isn’t an immediate concern as it would be in a recession). Other than bank loans and short-term Treasuries, though, every major bond index was down double digits
last year.
Turning to the high yield market, it too suffered in 2022 (down -11.22%), but the negative performance was driven almost entirely by the general rise in interest rates rather than a significant increase in investor’s risk premium as one might expect. High yield credit spreads ended the year at 480 basis points, up substantially from the start of 2022, but far below where historically they have indicated trouble ahead. That said, spread behavior will be a key indicator to monitor in the new year in gauging the odds of a hard or soft economic landing. The nature of that landing will have a great impact across asset class prices going forward.
Monetary Policy and the Fed: 2022 marked a momentous change in the Fed’s monetary regime. Chairman Powell and the FOMC, faced with a virulent price spiral for the first time in decades, initiated broad-based monetary tightening steps to slow inflation by slowing the economy. The Fed’s job was made more difficult as much of the rise in prices was caused in part by a global pandemic, a shift away from carbon-based energy, war and the largest fiscal spending increase since the New Deal, none of which were under its direct control.
The Fed is likely to continue to raise short term rates, albeit at a reduced pace, until labor markets slow significantly. Markets are expecting a 25-basis point hike in February with additional increase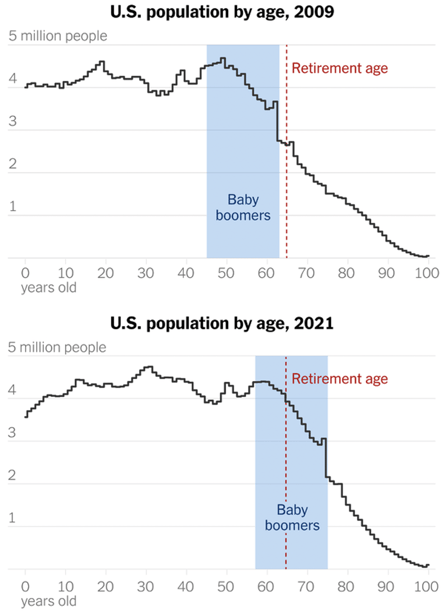 s dependent on incoming economic data. Although yet to be seen in current GDP (the Atlanta Fed projects real GDP to increase 4.1% in the 4th quarter of 2022), there is little doubt the economy’s tempo will slow going forward with both ISM Manufacturing and Services indexes now below 50% (which is the demarcation between expansion and contraction).
From a longer-term perspective, Fed policy makers are wrestling with, in their terms, a structural labor shortage that carries with it significant ramifications for markets. At a time when labor force preferences are changing - younger workers are more and more reluctant to take on a traditional 40-hour work week, particularly at hourly rates that barely keep up with the cost of living - the baby boom generation is retiring in droves, and unlike after the Great Financial Crisis of 2008, won’t be returning.
The combination of a change in work preferences among younger workers and the exodus of baby boomers from the workforce can be expected to put pressure on wage rates going forward. Any signs such wage increases are embedding themselves in long-term labor contracts will be met by additional monetary tightening by the Fed, a scenario that has negative consequences for inflation and long-term financial asset valuations.
Managed Income Strategy
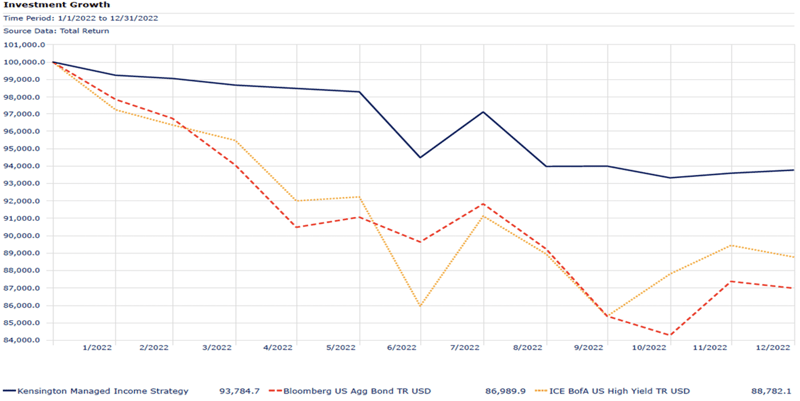
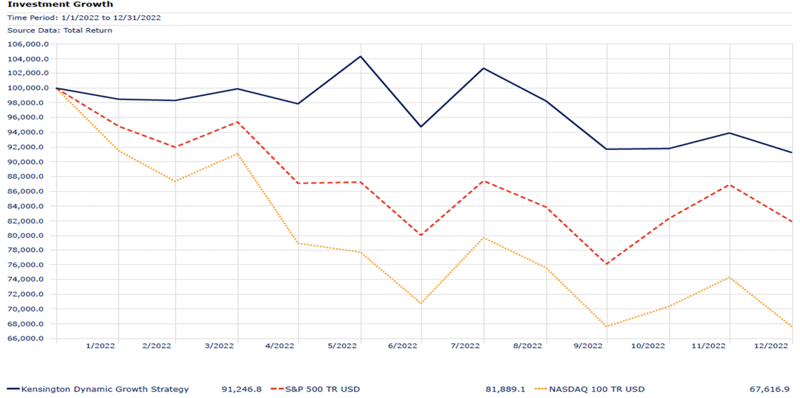
The Investment Growth chart reflects a hypothetical $100,000 investment in the strategy noted.
Performance is net of all fees and assumes reinvestment of dividends and capital gains.
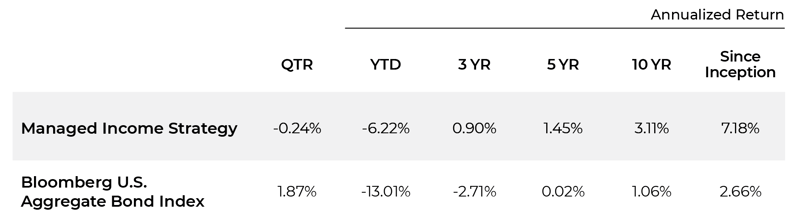
Performance information through 12/31/22 | Net of 1.5% annual investment advisory fee
Source: Morningstar, Inc.
Performance: The Managed Income Strategy finished down -6.22% for the year compared to -13.01% for the Bloomberg Aggregate Bond Index (AGG) and -11.22% for the ICE BofA US High Yield Index (HY Index).
Inception Date: 12/31/2007
Performance information through 12/31/22
Net of 1.5% annual investment advisory fee
Source: Morningstar, Inc.
Commentary: In a year that will be remembered as one of the worst performing years for the fixed income category in U.S. history, Managed Income found little opportunity for Risk-On investing, spending approximately 75% of the year in a Risk-Off posture.
In an environment that led to the worst performance in the Aggregate Bond Index’s 40-year history and only the second double-digit loss for 10-year Treasury Notes in history, Managed Income was able to sidestep much of the downside volatility, registering a monthly standard deviation for the year of 5.84%, compared to 8.33% and 11.85% for the AGG and High Yield Index, respectively. Perhaps most importantly, Managed Income had a 0.44 correlation to the AGG for the year, providing sorely needed portfolio diversification at a time when correlations across asset classes soared.
Dynamic Growth Strategy
The Investment Growth chart reflects a hypothetical $100,000 investment in the strategy noted.
Performance is net of all fees and assumes reinvestment of dividends and capital gains.
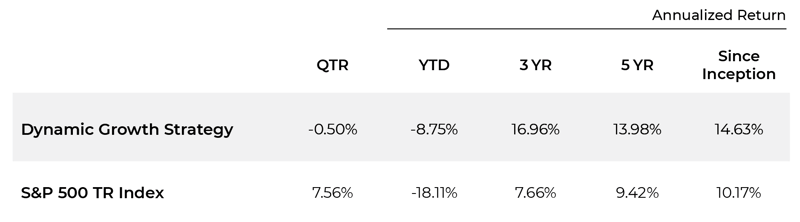
Performance information through 12/31/22 | Net of 1.5% annual investment advisory fee
Source: Morningstar, Inc.
Performance: Dynamic Growth finished the year at -8.75%, compared to the S&P 500 down -18.11% and the Nasdaq Composite Index (NASDAQ) down -32.38%.
Inception Date: 12/31/2014
Performance information through 12/31/22
Net of 1.5% annual investment advisory fee
Source: Morningstar, Inc.
Commentary: The first six months of the year (except for a brief burst upward in March) featured a generally consistent downtrend in equities. In response, Dynamic Growth was defensively postured for most of the first half of the year, avoiding 2022’s initial drawdowns. During this period, Dynamic Growth had three very short-lived trades in March, May, and June, ultimately breaking into positive performance territory in June before a Fed/Inflation induced selloff erased gains.
Following this selloff, equity markets started a chop-driven sequence, forming a giant W-shaped pattern over the last six months. In this time, Dynamic Growth entered two Risk-On trades: one during the July/August rally, and a short-lived trade in November, ultimately finishing the year 9.36% ahead of its primary benchmark, the S&P 500. Much of this relative success was driven by avoiding significant market drawdowns. For the year, Dynamic Growth was Risk-On for only 3 of 23 trading days where the S&P 500 experienced a decline of 2% or more. Importantly, the Strategy was able to reduce volatility throughout 2022, registering a monthly standard deviation of 17.44% net of fees (compared to 23.0% and 27.5% for the S&P 500 and Nasdaq, respectively) and correlation of 0.77 net of fees for the year to the S&P 500 and 0.58 correlation to the NASDAQ.
Active Advantage Strategy
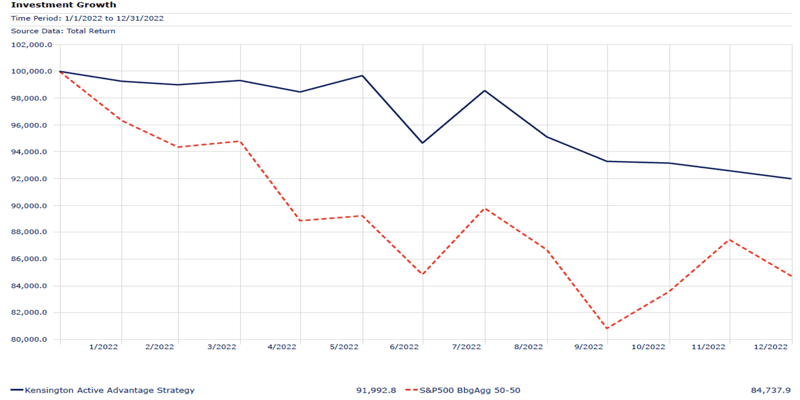
The Investment Growth chart reflects a hypothetical $100,000 investment in the strategy noted.
Performance is net of all fees and assumes reinvestment of dividends and capital gains.
Performance information through 12/31/22 | Net of 1.5% annual investment advisory fee
Source: Morningstar, Inc.
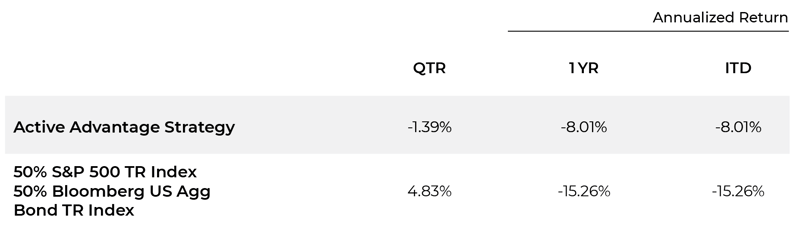
Performance: In Active Advantage’s inaugural year, the tactical Balanced Strategy registered an annual return of -8.01%, compared to -15.26% for its benchmark (a 50/50 split between the S&P 500 and the Bloomberg US Aggregate Bond Index).
Inception Date: 12/31/2021
Performance information through 12/31/22
Net of 1.5% annual investment advisory fee
Source: Morningstar, Inc.
Commentary: One of the more consistent topics in the investment community last year was the perceived “Death of the Balanced Fund,” with 2022 recording the 3rd worst year in history for the 60/40 stock/bond portfolio, ranking only behind 1931 (Great Depression) and 1937 (Market Crash). Historically, bonds have acted as a hedge to declining equity prices, insulating losses for Balanced investors. Last year’s unusually elevated correlation between stocks and bonds nullified the historical benefit of this natural hedge.
Given its more flexible mandate, Active Advantage was able to risk pivot defensively through the majority of 2022, moving to a 100% Risk-Off posture or an opportunistic posture (allocated 20% equities and 80% to cash). There were only two short periods where the Strategy was in its base 60/40 stock/bond posture, given the overall unattractive market environment. As a result, Active Advantage was able to avoid almost half of its benchmark’s drawdown in 2022, beating the index by 7.25%, with reduced overall volatility (7.90% standard deviation compared to 14.61% for its benchmark).
Looking Ahead to 2023
While 2022 was a disappointing year in terms of absolute performance for the Kensington Strategies, we believe we achieved our primary objectives of avoiding drawdowns, reducing volatility and preserving principal during extreme adverse market conditions. 2023 begins with further uncertainty across asset classes, but uncertainty breeds opportunity and we are excited to take advantage of those opportunities as they present themselves.
Equities: While equities have historically rallied on average 15% following down calendar years, the circumstances heading into 2023 appear unique from previous environments. Namely, the U.S. economy is facing persistent, albeit slowly abating, inflation and the possibility of a recession as corporate profits deteriorate. What seems most certain for equities is that volatility will persist as liquidity continues to dry up. In this environment we believe tactical equity strategies can play a meaningful role in navigating what is likely to be turbulent environment.
Source: Refinitiv Datastream
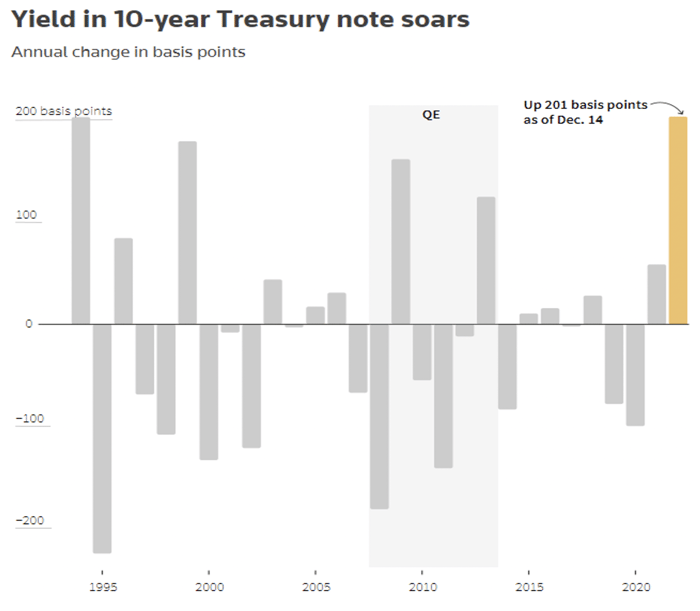
Fixed Income: Will the Fed continue to raise rates throughout 2023? Will we see a blowout in spreads in the face of a potential recession? These lingering questions present uncertainties for fixed income, but may also create attractive entry points for more nimble fixed income managers. 2022 marked the first time since the “Great Bond Massacre” of 1994 that the 10-year Treasury note yield increased 200 bps or more in a single year. It’s also only the fifth time since 1994 we’ve seen the 10-year yield increase 100 bps or more. In all five of those previous instances, bond yields reversed the following year, with 1995 a particularly large reversal of over 200 bps. With the increase in current yields, coupled with the prospect of reversal, 2023 may provide meaningful opportunities for patient fixed income investors.
2023 Playbook
As investors, it’s important to be prepared for whatever environment presents itself. With that in mind, below is a table of potential scenarios for 2023 and how we would expect to position our portfolios in such an environment:
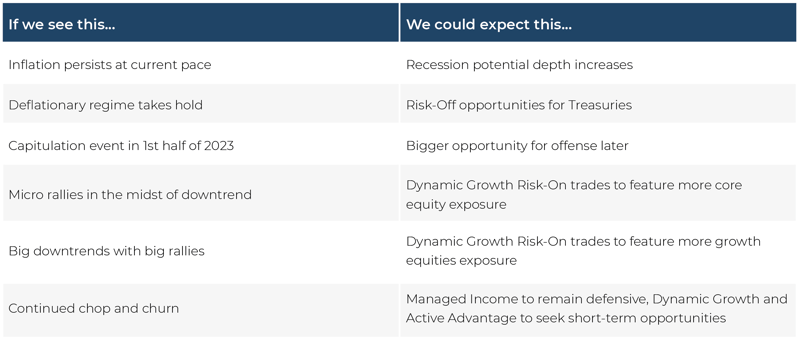
Regardless of which scenario (or scenarios) present themselves, we believe a tactical approach will prove valuable in navigating what are sure to be interesting markets in the months and years to come. We remain committed to executing on our primary mandate of generating steady above-average positive returns with low volatility and downside protection.
Disclaimer
Risks specific to the Managed Income Strategy include Management Risk, High-Yield Risk, Fixed-Income Security Risk, Foreign Investment Risk, Loans Risk, Market Risk, Underlying Funds Risk, Non-Diversification Risk, Turnover Risk, U.S. Government Securities Risk, LIBOR Risk, Models and Data Risk.
Risks specific to the Dynamic Growth Strategy include Management Risk, Equity Securities Risk, Market Risk, Underlying Funds Risk, Non-Diversification Risk, Small and Mid-Capitalization Companies Risk, Turnover Risk, U.S. Government Securities Risk, Models and Data Risk.
Risks specific to the Active Advantage Strategy include Management Risk, Equity Securities Risk, High-Yield Risk, Fixed-Income Security Risk, Foreign Investment Risk, Loans Risk, Market Risk, Underlying Funds Risk, Limited History of Operations Risk, Non-Diversification Risk, Small and Mid-Capitalization Companies Risk, Turnover Risk, U.S. Government Securities Risk, LIBOR Risk, Models and Data Risk.
Past performance is not indicative of future returns and the value of the investments and the income derived from them can go down as well as up. Future returns are not guaranteed and a loss of principal may occur. There is no guarantee any investment strategy will generate a profit or prevent a loss. Investing in securities involves risk, including loss of principal.
The types of securities held by a comparison benchmark may be substantially different from the investment strategy. An investor should consider the investment objectives, risks, charges, and expenses of the investment and the strategy carefully before investing. The S&P 500 TR Index is a capitalization weighted index of 500 stocks representing all major domestic industry groups. The S&P 500 TR Index assumes the reinvestment of dividends and capital gains. It is not possible to invest in an index, and index returns do not include management fees. The Bloomberg U.S. Aggregate Bond Index is a market capitalization-weighted intermediate term index which tracks the performance of investment grade rated debt publicly traded in the United States. It is not possible to invest directly in an index.
Investment returns will be reduced by advisory fees and other expenses charged in the management of a client’s account. You should understand how ongoing advisory fees, compounded over a number of years, reduce the value of your investment portfolio, as investment balances and potential gains on the investment balances are reduced by fees. Additional information is provided in the SEC Investors Bulletin “How Fees and Expenses Affect Your Investment Portfolio.”