


by Craig Love, on April 27, 2023
Kensington Market Insights - April 6
Market Insights is a weekly piece in which Kensington’s Portfolio Management team will share interesting and thought-provoking charts that we believe provide insight into markets and the current investment landscape.
Debt Ceiling in View
Last week was one of the calmer trading periods in recent memory, with the S&P 500 closing each day between up and down 0.6% (first time since November 2021) and the CBOE Volatility Index sinking below 17 (first time since January 2022). The calm did not last, however, as over the weekend U.S. debt ceiling concerns were elevated when it was announced that Treasury tax receipts were down 29% month-to-date relative to last year (chart below), leading Goldman Sachs’ analysts to project the government will hit the $31.4 trillion debt ceiling sooner than expected, perhaps as early as the first half of June.
Treasury Tax Receipts are Now Down 29% Month-to-Month Relative to Last Year
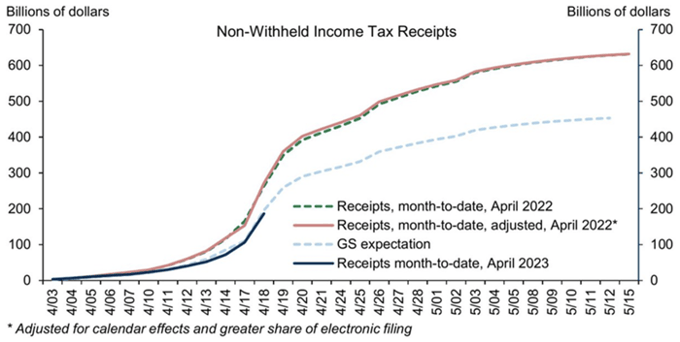
Source: Goldman Sachs
Default Risk?
The implications of hitting the debt ceiling are not trivial, but the risk of actual default is seemingly minor, if even possible at all. David Rivkin suggests in the Wall Street Journal that the federal government can’t legally default, as the constitution commands that all credits must be paid in Section 4 of the 14th Amendment, “The validity of the public debt of the United States, authorized by law, . . . shall not be questioned.” Further, Alan Greenspan said during the 2011 Debt Ceiling Crisis, “The United States can pay any debt it has because we can always print money to do that. So, there is zero probability of default.”
Market participants are not so certain, as evidenced by the chart below, which shows U.S. Sovereign 1-year Credit Default Swaps - derivatives that act like insurance and pay out if a company, or country, reneges on its borrowings in the next 12 months – are trading at their highest level since at least 2008, and far in excess of 2011 levels, when we faced a similar crisis.
U.S. Sovereign 1-Year CDS Spread
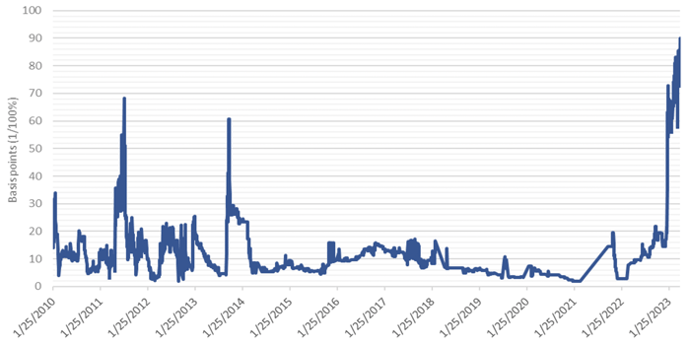
Source: Kensington Asset Management; Data: Refinitv
The Market is Taking Notice
In addition to the Credit Default Swap (“CDS”) market, Treasury investors are taking notice as well with money flooding in to 1-month treasury bills, pushing the spread between 3-month to 1-month treasuries to 1.8%, a multi-decade high. One factor influencing this is the recent rise in money market funds, many of which must allocate to Treasuries, and are choosing 1-month issuances to avoid perceived risk of default over the summer.
Surge Into Shortest-Term Bills Suggests Deep Apprehension Over the Summer
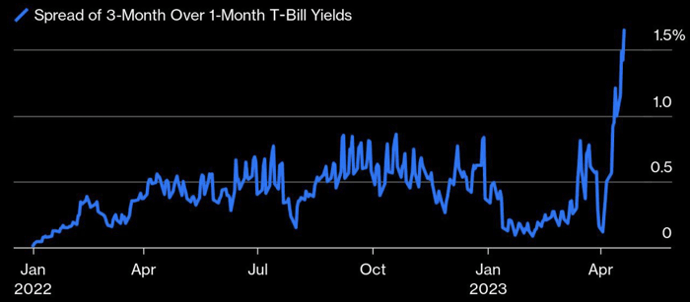
Source: Bloomberg
Whether or not the risk of default is real, or simply political grandstanding, is almost beside the point. Just the threat of default can have significant market implications, as the 2011 Debt Ceiling Crisis demonstrates below. During the 2011 crisis we saw markets top out on the last trading day of April 2011 with the S&P 500 marking down from there 19.4% through October 4th. During this period there was reduced household spending, decreased private business investment, and eroding consumer and corporate confidence as the crisis loomed.
S&P 500 - 2011 Debt Crisis vs 2023
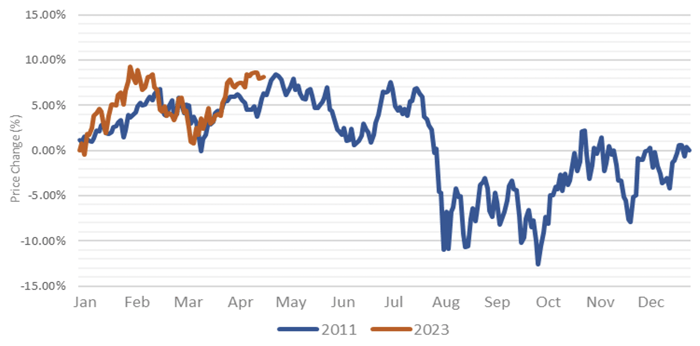 Chart: Kensington Asset Management; Data: Yahoo Finance
Whether 2023 will suffer a similar fate will depend largely on whether a resolution can be achieved before the debt ceiling is reached. In the face of declining earnings, a potential credit crunch, and flashing recession signs, the last thing the market needs is a loss in confidence of the ability of the U.S. Government to meet its obligations. The stakes are high and calculated - measured portfolio management is likely to be critical.
Forward-looking statements are based on management’s then current views and assumptions and, as a result, are subject to certain risks and uncertainties that could cause actual results to differ materially from those projected. This market insight is for informational purposes only and should not be construed as a solicitation to buy or sell, or to invest in any investment product or strategy. Investing involves risk including loss of principal.
Disclaimer
Risks specific to the Managed Income Strategy include Management Risk, High-Yield Risk, Fixed-Income Security Risk, Foreign Investment Risk, Loans Risk, Market Risk, Underlying Funds Risk, Non-Diversification Risk, Turnover Risk, U.S. Government Securities Risk, LIBOR Risk, Models and Data Risk.
Risks specific to the Dynamic Growth Strategy include Management Risk, Equity Securities Risk, Market Risk, Underlying Funds Risk, Non-Diversification Risk, Small and Mid-Capitalization Companies Risk, Turnover Risk, U.S. Government Securities Risk, Models and Data Risk.
Risks specific to the Active Advantage Strategy include Management Risk, Equity Securities Risk, High-Yield Risk, Fixed-Income Security Risk, Foreign Investment Risk, Loans Risk, Market Risk, Underlying Funds Risk, Limited History of Operations Risk, Non-Diversification Risk, Small and Mid-Capitalization Companies Risk, Turnover Risk, U.S. Government Securities Risk, LIBOR Risk, Models and Data Risk.
Past performance is not indicative of future returns and the value of the investments and the income derived from them can go down as well as up. Future returns are not guaranteed and a loss of principal may occur. There is no guarantee any investment strategy will generate a profit or prevent a loss. Investing in securities involves risk, including loss of principal.
The types of securities held by a comparison benchmark may be substantially different from the investment strategy. An investor should consider the investment objectives, risks, charges, and expenses of the investment and the strategy carefully before investing. The S&P 500 TR Index is a capitalization weighted index of 500 stocks representing all major domestic industry groups. The S&P 500 TR Index assumes the reinvestment of dividends and capital gains. It is not possible to invest in an index, and index returns do not include management fees. The Bloomberg U.S. Aggregate Bond Index is a market capitalization-weighted intermediate term index which tracks the performance of investment grade rated debt publicly traded in the United States. It is not possible to invest directly in an index.
Investment returns will be reduced by advisory fees and other expenses charged in the management of a client’s account. You should understand how ongoing advisory fees, compounded over a number of years, reduce the value of your investment portfolio, as investment balances and potential gains on the investment balances are reduced by fees. Additional information is provided in the SEC Investors Bulletin “How Fees and Expenses Affect Your Investment Portfolio.”