


by Craig Love, on May 11, 2023
Kensington Market Insights - May 11
Market Insights is a weekly piece in which Kensington’s Portfolio Management team will share interesting and thought-provoking charts that we believe provide insight into markets and the current investment landscape.
Banking Back in Focus
In our March 16, 2023 Market Insights piece we discussed the possibility of contagion in the banking sector in the wake of the Silicon Valley Bank collapse. Since the time of that writing two additional banks have failed and the S&P Regional Bank Index is down approximately 35% year-to-date, pushing the market cap of these banks from over $300B in March to just over $100B today, a staggering 66% drop in just two months.
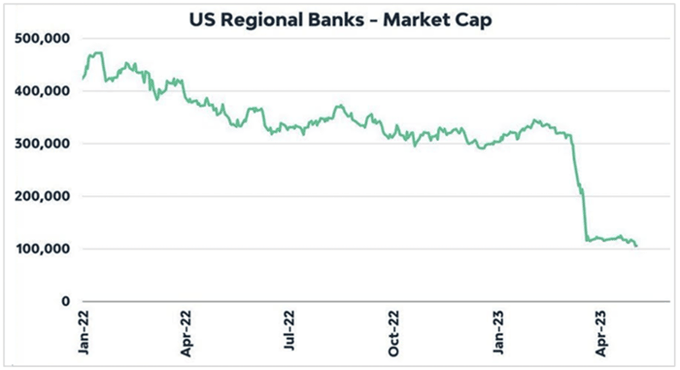
Source: True Insights, Investing.com
Perhaps more shocking is that we haven’t seen more failures during this period of value decline and deposit outflows. By contrast, during the Great Financial Crisis (GFC) the Federal Deposit Insurance Corporation (FDIC) closed 465 failed banks between 2008 to 2012. So far in 2023 there have been just three, although their combined assets are more than the GFC bank failure assets combined ($532B vs $526B). It begs the question, if these relatively larger banks have been unable to navigate the current landscape, why haven’t we seen more small banks collapse as well?
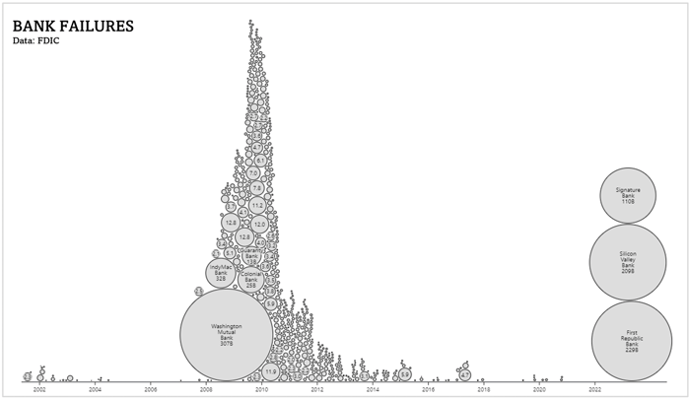
Source: ObservableHQ
On Stable Ground?
Despite stock prices dropping, we have seen some relief in the banking sector in recent weeks. Regional deposits rose $6.4 billion over the last week, and lending increased by $30.6 billion, according to Federal Reserve data. In the March FOMC meeting Federal Chair Powell said, “Conditions in that sector (banking) have broadly improved since early March” and that the banking system is “sound and resilient."
It can be argued whether that is the case or not, but even the Fed knows banks are not out of the woods just yet. In their latest Financial Stability Report released on Monday, they note that trouble in the commercial real estate sector is a possible risk to the U.S. financial system, stating, “Valuations in the commercial segment also remained near historical highs even though price declines have been widespread. In addition, fundamentals have weakened, particularly for the office segment.”
The report continues by saying, “The magnitude of a correction in property values could be sizable and therefore could lead to credit losses by holders of C.R.E. debt," noting that many of those holders are banks, and particularly smaller banks. In fact, regional banks are 4.5 times more exposed to commercial real estate loans than national banks, with several holding over 50% of their total loans in commercial real estate loans (as shown below).
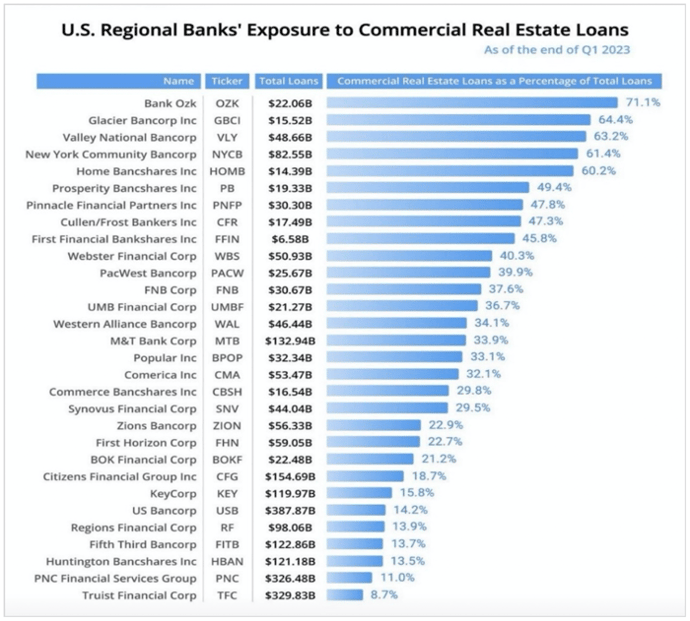
Source: BBAE Research
Between a Rock and a Hard Place
With over $1 trillion of commercial real estate loans set to mature by 2025, we have to question how willing these banks will be to renew these loans given tightening lending standards, decreasing property values and higher prevailing interest rates. If they aren’t, it could mean a significant rise in defaults on their existing loan books, exacerbating current issues. As previously noted, credit is the lifeblood of our economy, and the ramifications of this potential credit crunch could reach far beyond just commercial real estate and regional banks.
Forward-looking statements are based on management’s then current views and assumptions and, as a result, are subject to certain risks and uncertainties that could cause actual results to differ materially from those projected. This market insight is for informational purposes only and should not be construed as a solicitation to buy or sell, or to invest in any investment product or strategy. Investing involves risk including loss of principal.
Disclaimer
Risks specific to the Managed Income Strategy include Management Risk, High-Yield Risk, Fixed-Income Security Risk, Foreign Investment Risk, Loans Risk, Market Risk, Underlying Funds Risk, Non-Diversification Risk, Turnover Risk, U.S. Government Securities Risk, LIBOR Risk, Models and Data Risk.
Risks specific to the Dynamic Growth Strategy include Management Risk, Equity Securities Risk, Market Risk, Underlying Funds Risk, Non-Diversification Risk, Small and Mid-Capitalization Companies Risk, Turnover Risk, U.S. Government Securities Risk, Models and Data Risk.
Risks specific to the Active Advantage Strategy include Management Risk, Equity Securities Risk, High-Yield Risk, Fixed-Income Security Risk, Foreign Investment Risk, Loans Risk, Market Risk, Underlying Funds Risk, Limited History of Operations Risk, Non-Diversification Risk, Small and Mid-Capitalization Companies Risk, Turnover Risk, U.S. Government Securities Risk, LIBOR Risk, Models and Data Risk.
Past performance is not indicative of future returns and the value of the investments and the income derived from them can go down as well as up. Future returns are not guaranteed and a loss of principal may occur. There is no guarantee any investment strategy will generate a profit or prevent a loss. Investing in securities involves risk, including loss of principal.
The types of securities held by a comparison benchmark may be substantially different from the investment strategy. An investor should consider the investment objectives, risks, charges, and expenses of the investment and the strategy carefully before investing. The S&P 500 TR Index is a capitalization weighted index of 500 stocks representing all major domestic industry groups. The S&P 500 TR Index assumes the reinvestment of dividends and capital gains. It is not possible to invest in an index, and index returns do not include management fees. The Bloomberg U.S. Aggregate Bond Index is a market capitalization-weighted intermediate term index which tracks the performance of investment grade rated debt publicly traded in the United States. It is not possible to invest directly in an index.
Investment returns will be reduced by advisory fees and other expenses charged in the management of a client’s account. You should understand how ongoing advisory fees, compounded over a number of years, reduce the value of your investment portfolio, as investment balances and potential gains on the investment balances are reduced by fees. Additional information is provided in the SEC Investors Bulletin “How Fees and Expenses Affect Your Investment Portfolio.”