


by Craig Love, on May 18, 2023
Kensington Market Insights - May 18
Market Insights is a weekly piece in which Kensington’s Portfolio Management team will share interesting and thought-provoking charts that we believe provide insight into markets and the current investment landscape.
(Consumer) Debt Crisis
Recent news coverage has primarily focused on the US Debt Ceiling Crisis and, to a lesser extent, potential warning signs in commercial debt. However, there is another looming debt crisis that has received little attention so far: Consumer Debt. This week the Federal Reserve Bank of New York released their Q1 2023 Household Debt and Credit Report, which showed consumer debt recently hit an all time high, expanding to $17.05 trillion in Q1 2023, up over 20% from 2019 (below).
Total Consumer Debt Balance by Category
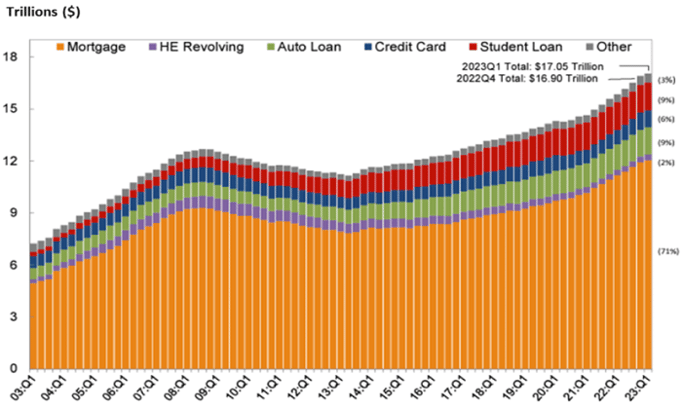
Source: New York Fed Consumer Credit Panel/Equifax
Among all consumer debt, mortgages constitute the majority, accounting for 71% of the total outstanding debt (73% if you include Home Equity Loans). Student Loans ($1.6 trillion), Auto Loans ($1.6 trillion), and Credit Cards ($986 billion) make up the rest. While mortgage debt carries its own risks, it is the non-housing debt balances that may pose the most significant near-term challenges for the economy and the market.
Spending Tomorrow’s Money Today
Traditionally, consumer credit card debt levels decrease in the first quarter each year as people pay down holiday spending balances. However, this year has been an exception, in which we saw an increase in Q1 and a record-breaking 17% increase in balances over the past four quarters (below).
U.S. Consumer Credit Card Debt
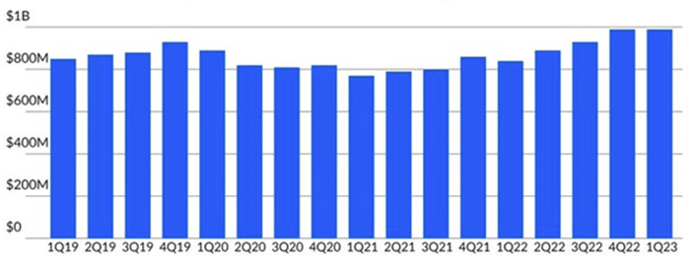
Source: Federal Reserve Bank of New York
This all comes at a precarious time as the average interest rates across all consumer loan types have risen sharply over the last 12 months. Presently, the average interest rate for credit cards exceeds 20%, with auto loans not far behind (used: 14%, new: 9%). The combination of increasing balances and rising interest rates is starting to impact consumers. Currently, 2.6% of outstanding debt is in some stage of delinquency, with credit cards and auto loans leading the way, each experiencing 30-day delinquency rates exceeding 6%, the highest levels since Q1 2020 during the onset of COVID. While these levels are not unusual in absolute terms, the rate at which they are rising is cause for concern.
The only segment of consumer debt that has not seen a sharp move up in delinquencies over the last year is student loan debt. However, this summer, payments on student loans will resume for the first time since the pandemic, at an average interest rate of 5.8%, up 24% since 2020.
Percent of Balance 30 Day Delinquency
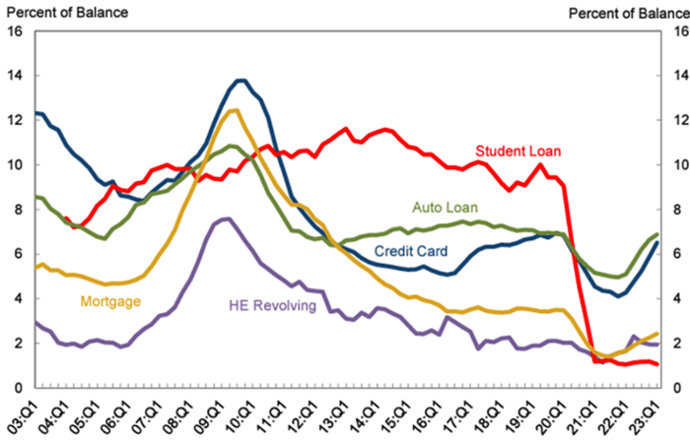
Source: New York Fed Consumer Credit Panel/Equifax/4 Quarter Moving Sum
Economic Impact
The long-term impact of this consumer debt bubble is yet to be determined, but the immediate repercussion is likely to be felt in consumer spending and ultimately GDP growth. We have previously discussed slowing GDP, and this week, we may be observing the initial effects on consumer spending. According to the April Retail Sales report released by the Census Bureau, there was a mere 0.5% increase compared to last year, the lowest growth rate since May 2020 and well below the historical average of 4.8%. However, after adjusting for inflation, the situation is far more concerning. Real retail sales have fallen by 4.2% over the past year, marking the sixth consecutive year-over-year decline and reaching the lowest level since COVID and the Great Financial Crisis.
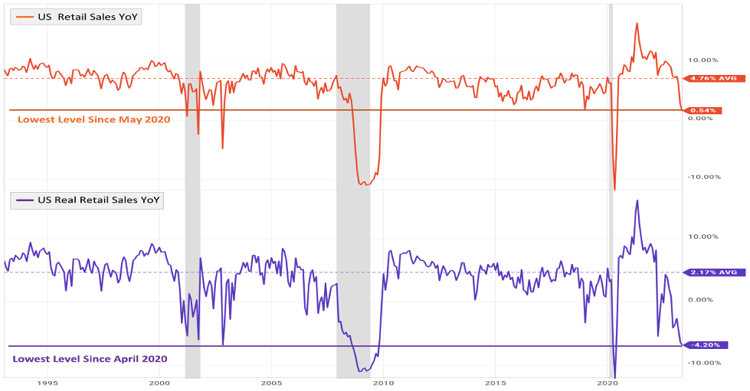
Source: YCharts
The United States is currently grappling with a debt problem on all fronts: federal, commercial, and now consumer debt. While the country has long relied on credit markets to foster growth, the interest rate environment today is markedly different than it’s been for several decades, potentially stressing the system. If the Federal Reserve maintains a policy of higher interest rates for an extended period, the implications for the country's ability to service this debt could be significant.
Forward-looking statements are based on management’s then current views and assumptions and, as a result, are subject to certain risks and uncertainties that could cause actual results to differ materially from those projected. This market insight is for informational purposes only and should not be construed as a solicitation to buy or sell, or to invest in any investment product or strategy. Investing involves risk including loss of principal.
Disclaimer
Risks specific to the Managed Income Strategy include Management Risk, High-Yield Risk, Fixed-Income Security Risk, Foreign Investment Risk, Loans Risk, Market Risk, Underlying Funds Risk, Non-Diversification Risk, Turnover Risk, U.S. Government Securities Risk, LIBOR Risk, Models and Data Risk.
Risks specific to the Dynamic Growth Strategy include Management Risk, Equity Securities Risk, Market Risk, Underlying Funds Risk, Non-Diversification Risk, Small and Mid-Capitalization Companies Risk, Turnover Risk, U.S. Government Securities Risk, Models and Data Risk.
Risks specific to the Active Advantage Strategy include Management Risk, Equity Securities Risk, High-Yield Risk, Fixed-Income Security Risk, Foreign Investment Risk, Loans Risk, Market Risk, Underlying Funds Risk, Limited History of Operations Risk, Non-Diversification Risk, Small and Mid-Capitalization Companies Risk, Turnover Risk, U.S. Government Securities Risk, LIBOR Risk, Models and Data Risk.
Past performance is not indicative of future returns and the value of the investments and the income derived from them can go down as well as up. Future returns are not guaranteed and a loss of principal may occur. There is no guarantee any investment strategy will generate a profit or prevent a loss. Investing in securities involves risk, including loss of principal.
The types of securities held by a comparison benchmark may be substantially different from the investment strategy. An investor should consider the investment objectives, risks, charges, and expenses of the investment and the strategy carefully before investing. The S&P 500 TR Index is a capitalization weighted index of 500 stocks representing all major domestic industry groups. The S&P 500 TR Index assumes the reinvestment of dividends and capital gains. It is not possible to invest in an index, and index returns do not include management fees. The Bloomberg U.S. Aggregate Bond Index is a market capitalization-weighted intermediate term index which tracks the performance of investment grade rated debt publicly traded in the United States. It is not possible to invest directly in an index.
Investment returns will be reduced by advisory fees and other expenses charged in the management of a client’s account. You should understand how ongoing advisory fees, compounded over a number of years, reduce the value of your investment portfolio, as investment balances and potential gains on the investment balances are reduced by fees. Additional information is provided in the SEC Investors Bulletin “How Fees and Expenses Affect Your Investment Portfolio.”