


by Craig Love, on June 01, 2023
Kensington Market Insights - June 1
Market Insights is a weekly piece in which Kensington’s Portfolio Management team will share interesting and thought-provoking charts that we believe provide insight into markets and the current investment landscape.
Debt Limit Deal - Market Implications
With Congress voting to support the recently agreed-upon debt limit bill, the threat of a US default has been averted. However, it is crucial to address the implications of this deal and examine how it may impact markets and the economy in the short and long term. Let's delve into some of the ramifications of the agreement and explore its potential effects.
Short-Term Considerations
During periods requiring a debt ceiling extension, the Treasury's cash balance for daily operations tends to reach extremely low levels, and today is no exception. With the agreement now in place, the government must promptly issue debt to sustain its functions due to the persistent fiscal deficit imbalance. It is estimated that the Treasury will issue $700 billion in debt in the coming weeks, with the total amount reaching $1.2 trillion by October 2023.
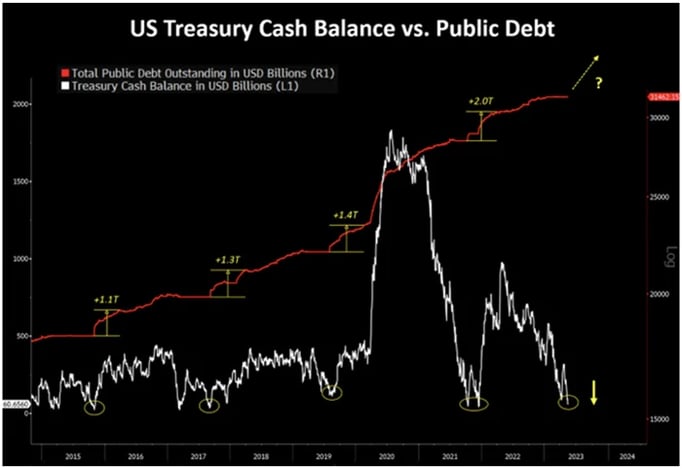
Source: Crescat Capital LLC
Immediate Impact on Equity & Fixed Income Markets
Equities: The issuance of Treasury debt, as you have likely read, will lead to a decline in overall market liquidity. Since January, one of the significant factors driving the market rally has been the influx of liquidity into the system. However, we are now likely to witness the opposite effect. As shown in the chart below, there is a strong correlation between Fed liquidity and the S&P 500. With liquidity leaving the market, a reversal in the equity market may be imminent.
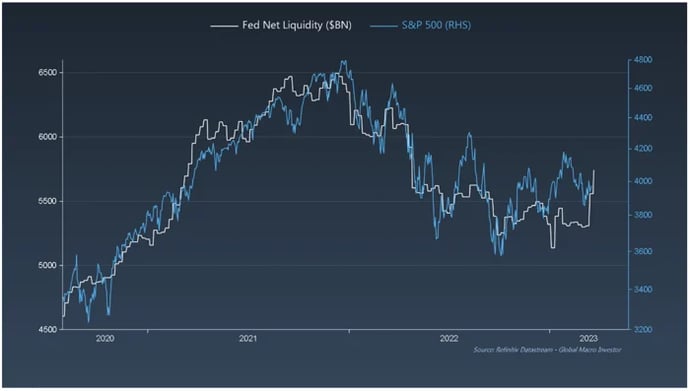
Source: Raoul Pal, Real Vision Group
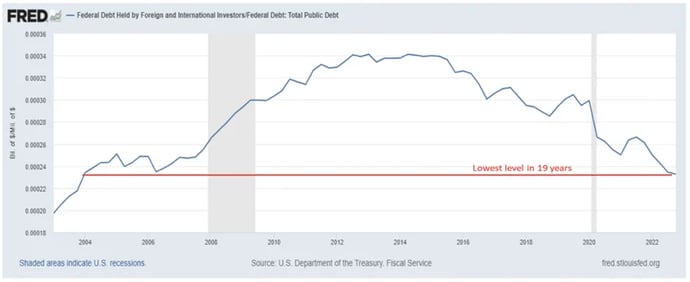
Fixed Income: With the Federal Funds rate currently at 5-5.25%, the yield on these new Treasury issuances will likely need to be higher to attract demand. This is particularly important as foreign interest in US Treasuries has waned in recent years, reaching its lowest level as a percentage of overall debt in 19 years (see below). The higher rates and significant level of supply will likely push down bond prices as rates increase to generate demand.
Long-Term Impact
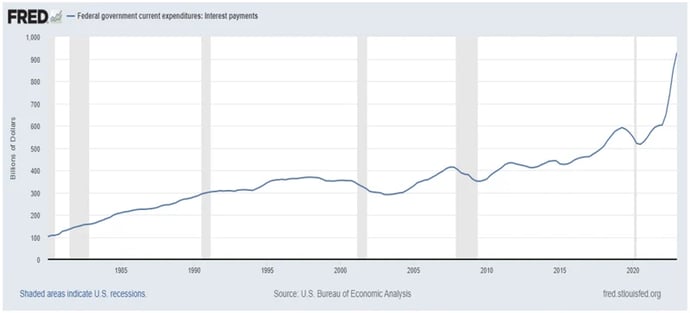
The federal debt currently exceeds $31 trillion, with the debt-to-GDP ratio standing at 118%. Although this is lower than the peak of 129% during the COVID pandemic, it remains well above the historical range. Moreover, the increase in the Federal Funds rate over the past year means higher payments to fund the interest on the debt. The current amount of federal government interest payment is approaching the $1 trillion mark (see below) and is soon expected to become the largest expense for the US government.
The long-term impact of this situation is undoubtedly slower economic growth, which in turn affects the US financial markets. When the government issues debt and uses that money to pay off other debt instead of investing in the economy, it has an impact on economic growth. Although this issue will eventually need to be addressed (possibly not until 2025 when a new debt ceiling crisis arises), investors should take note and understand the immediate implications as well.
Forward-looking statements are based on management’s then current views and assumptions and, as a result, are subject to certain risks and uncertainties that could cause actual results to differ materially from those projected. This market insight is for informational purposes only and should not be construed as a solicitation to buy or sell, or to invest in any investment product or strategy. Investing involves risk including loss of principal.
Disclaimer
Risks specific to the Managed Income Strategy include Management Risk, High-Yield Risk, Fixed-Income Security Risk, Foreign Investment Risk, Loans Risk, Market Risk, Underlying Funds Risk, Non-Diversification Risk, Turnover Risk, U.S. Government Securities Risk, LIBOR Risk, Models and Data Risk.
Risks specific to the Dynamic Growth Strategy include Management Risk, Equity Securities Risk, Market Risk, Underlying Funds Risk, Non-Diversification Risk, Small and Mid-Capitalization Companies Risk, Turnover Risk, U.S. Government Securities Risk, Models and Data Risk.
Risks specific to the Active Advantage Strategy include Management Risk, Equity Securities Risk, High-Yield Risk, Fixed-Income Security Risk, Foreign Investment Risk, Loans Risk, Market Risk, Underlying Funds Risk, Limited History of Operations Risk, Non-Diversification Risk, Small and Mid-Capitalization Companies Risk, Turnover Risk, U.S. Government Securities Risk, LIBOR Risk, Models and Data Risk.
Past performance is not indicative of future returns and the value of the investments and the income derived from them can go down as well as up. Future returns are not guaranteed and a loss of principal may occur. There is no guarantee any investment strategy will generate a profit or prevent a loss. Investing in securities involves risk, including loss of principal.
The types of securities held by a comparison benchmark may be substantially different from the investment strategy. An investor should consider the investment objectives, risks, charges, and expenses of the investment and the strategy carefully before investing. The S&P 500 TR Index is a capitalization weighted index of 500 stocks representing all major domestic industry groups. The S&P 500 TR Index assumes the reinvestment of dividends and capital gains. It is not possible to invest in an index, and index returns do not include management fees. The Bloomberg U.S. Aggregate Bond Index is a market capitalization-weighted intermediate term index which tracks the performance of investment grade rated debt publicly traded in the United States. It is not possible to invest directly in an index.
Investment returns will be reduced by advisory fees and other expenses charged in the management of a client’s account. You should understand how ongoing advisory fees, compounded over a number of years, reduce the value of your investment portfolio, as investment balances and potential gains on the investment balances are reduced by fees. Additional information is provided in the SEC Investors Bulletin “How Fees and Expenses Affect Your Investment Portfolio.”