


by Craig Love, on June 22, 2023
Kensington Monthly Market Commentary: April 2023
Geopolitics: The ongoing political tensions between the U.S. and China continue with both domestic corporate and asset managers struggling with the question of how best to manage that relationship within the worlds they occupy. Does this mean a pivot away from China and if so, of what dimension, scale and duration? Of course, that decision is far easier to make for asset managers where monies can be moved relatively easily. In contrast, corporations have to assess the impact on operations a wholescale revamping of supply chains will have and the associated cost. In addition, abandoning a market the size of China’s is a decision not to be taken lightly and may not be even feasible, at least in the short term. That said, some sort of disentanglement appears inevitable and until the new rules of engagement come into clear focus, asset managers have decided to reallocate at least some of their monies elsewhere.
Nowhere is that more apparent than in the performance of Japan’s TOPIX Index1. Through the end of May, the index had appreciated approximately 20.57% YTD, far outperforming the MSCI World Index2 return of 7.68% YTD. Japan is viewed as a politically benign way to invest in the ongoing expansion of Asian markets whose valuation – at least until recently - has been relatively cheap. The country’s attractiveness has increased in recent months, due to the real possibility of corporate governance reforms. As reported in the Financial Times, Hiromi Yamaji, the new head of the Japan Exchange Group, which controls the Tokyo Stock Exchange (“TSE”), suggested the bourse intended to take a stronger position in pushing companies to raise their corporate value. Companies need to pay closer attention to their price-to-book ratio, share price and capital cost, he told Japanese media, declaring that he was “not satisfied” with the way many listed companies had implemented the 2015 governance code.
The widely publicized investments by Warren Buffett in Japan’s five major trading houses has added to investor enthusiasm with several high profile institutional investors ramping up activities there. The result has been a re-rating of share prices, with the TOPIX reaching a 33-year high over the course of the month.
Stock market: The capitalization-weighted S&P 5003 was essentially flat for the month (+0.25%), far outperforming its equal weighted counterpart, the S&P Equal Weight Index (SPXEW: -3.99%) and the small-cap Russell 20004 (-1.09%), while significantly lagging the Nasdaq 1005, up a robust 7.61% in May. As has been pointed out, most of the excitement in equities over the course of the month was driven by the new thing, generative artificial intelligence, what it means, how it will affect the workplace and which companies stand to benefit. As often happens with the introduction of a “new” technology to an unfamiliar investing public, one which will undeniably introduce monumental change and will be quite positive to corporate bottom lines over time, enthusiasm will quickly reach a fever pitch. Nowhere is this more evident than the stock performance of Nvidia – the market’s ground zero for all things AI – which was up 36.34% in the month and 264.33% YTD. These sorts of returns are sometimes seen in the small and micro-cap sectors of the market but for a company that began the year with a $360 billion dollar capitalization, the numbers are quite extraordinary.
Investor psychology can engender its own demand, not only among individuals who fear missing out, but also among institutional investors whose relative performance – or lack of – can force participation in an uptrend so as not to fall too far behind. This is why, in part, momentum-based strategies have historically worked well when used in conjunction with appropriate risk management tools.
Looking forward, the market continues to struggle with the timing of a possible recession and the long-term outlook for inflation. Current 12-month forward consensus earnings for the S&P 500 are ~$232.22, putting the index’s P/E ratio at 18. According to FactSet, that’s below the 5-year average (18.6) but above the 10-year average (17.3). Still, as shown in the graph below, if one were to exclude the top 50 stocks in the index, the S&P 500 trades at a much more reasonable 15x earnings valuation.
Excluding Top 50 Stocks, the S&P 500 Trades at Just 15x Trailing P/E
S&P 500 Trailing P/E Ex-Top 50 vs. Top 50 Stocks (1986-5/23)
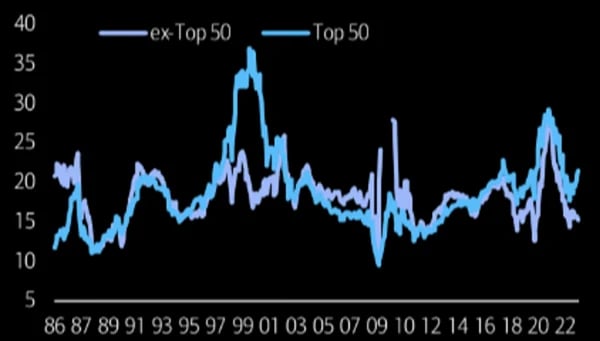
Source: The Market Ear, as of May 2023
The bear case of course is those earnings, at least in the short term, won’t be achieved if the aforementioned recession materializes, causing the market to correct in due course. It’s interesting to note in this regard that although median revenue for companies in the S&P 500 grew by 13% in Q1 2023, all of that growth came from price increases as median volume dropped -0.6%.
While the bears may be right, investors must also keep in mind whether positioning as a whole reflects that possibility. To that point, according to Bank of America’s May survey of global fund managers, participants had lifted equity allocations to a 5-month high while also raising cash allocations. Such moves would seem to indicate portfolio managers lack conviction but feel compelled to invest so as not to fall behind in the relative performance race.
Fixed Income: The positive economic news in May (solid personal spending, well controlled inventories, strong construction spending, industrial production gains MoM) boosted investor hopes any economic slowdown would be of the “soft landing” variety, spurring calls of a return to a goldilocks economy. Investors who had retreated to the bond market in anticipation of the well-advertised recession were forced to re-calibrate their economic forecasts and contemplate the specter of a higher for longer rate policy. Bonds retreated during the month as a result, with losses seen across all major sectors. The benchmark 10-year Treasury6 fell 1.46%, the Bloomberg U.S. Corporate Investment Grade Index7 lost -1.45%, the Bloomberg Mortgage Backed Securities Index8 declined -0.73% and even the more economically sensitive Bloomberg US Corporate High Yield Index9 saw losses, down -0.92%.
With the recent passing of a debt ceiling bill by Congress, eyes have now turned to the needed replenishment of the U.S. Treasury’s General Account (“TGA”). The TGA is the general “checking account” the Treasury uses to make the federal government’s official payments. In the weeks prior to the debt ceiling settlement, the account had been substantially drawn down to fund the government’s day to day operations. Now that an agreement is in place, the Treasury will need to raise over a billion dollars over the next few months to replenish the coffers. The Treasury will issue short-term bills in its attempt to minimize the impact to the overall yield curve and risk assets in general. Many market observers are concerned the significant size of the Treasury auctions will act as a liquidity vacuum, draining liquidity out of markets, resulting in downward pressure on asset prices across the board.
Whether it does or not may depend on the interplay of an arcane Federal Reserve program known as the Reverse Repo Facility (“RRF”). In brief, the RRF allows financial firms and others to earn interest on large cash balances by depositing those monies with the Fed. Money market funds, which have seen heavy inflows from investors seeking higher rates of return from what banks offer, are using the RRF to generate those returns. Some analysts contend this is effectively draining funds from the banking system, while at the same time putting pressure on banks’ net interest margin as they compete to raise rates to attract depositors. And as bank deposits decrease, the thought is lending will soon follow, acting as a depressant on overall Gross Domestic Product (“GDP”) growth.
Billions of dollars have accumulated in the RRF and many are watching closely how those balances change as the Treasury implements its funding program. The hope is more funding will come from the RRF, rather than public markets lessening the potential negative effect.
Federal Reserve and Monetary Policy: The labor markets are showing the first signs of major slowdown, with initial jobless claims reporting the highest figure since October 2021 and the unemployment rate increasing to 3.7%. The number of job openings has been steadily decreasing since peaking in March 2022 (although remain quite elevated by historical standards). Job quits reflect a similar downward trend.
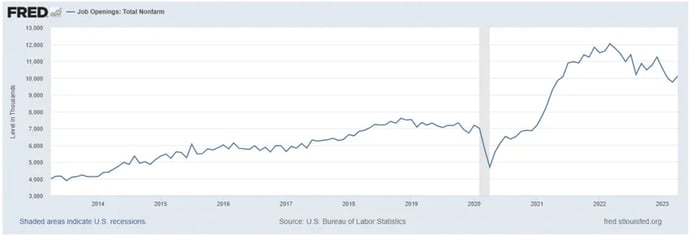
As of May 2023
Other leading labor indicators of recession are big drawdowns in temporary employment and job openings, both of which have been trending down. In sum, the picture is turning increasingly negative, suggesting that economic storm clouds are gathering, but still some ways off on the horizon.
Turning to the inflation front, the core Personal Consumption Expenditure price index rose by 4.7% in April (reported in May). The key takeaway from the graph below is while overall prices are no longer increasing, neither are they decreasing. The longer this continues to be the case, the greater the odds the economy is entering a period of stagflation where economic growth slows, but inflation remains stubbornly high.
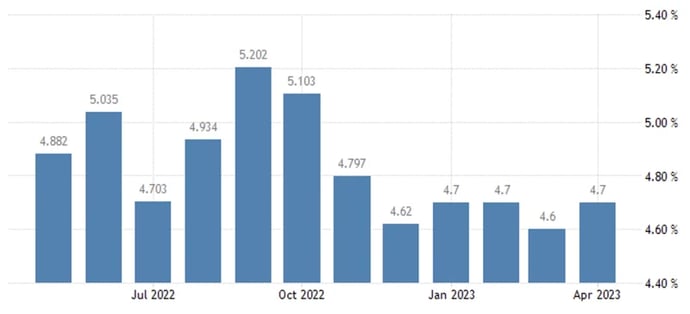
As of April 2023
One future bright spot is the Bureau of Labor Statistics’ Owners’ Equivalent Rent of Residences (“OER”). OER measures the majority of the change in the shelter cost that consumers experience. Since the shelter component of the Consumer Price Index (“CPI”) accounts for ~35% of the total basket, with OER accounting for ~25%, it is a major driver of price changes in the CPI. The OER typically lags other measures of market rents by between nine and twelve months, so its net effect has been to boost the rate of inflation. As shown in the graph below, increases in the asking prices for new rental leases have slowed sharply, but this has yet to be reflected in OER. Both Zillow and ApartmentList reflect new leases, whereas most rental units don’t turnover every year. (By comparison, the Bureau of Labor Statistics (“BLS”) collects the data on rent for about 50,000 residences through personal visits or telephone calls. Since rents do not change frequently, the rent of each unit is sampled every six months). The sharp increase in new lease rates in 2021 and early 2022 is just now beginning to spill over into the CPI.
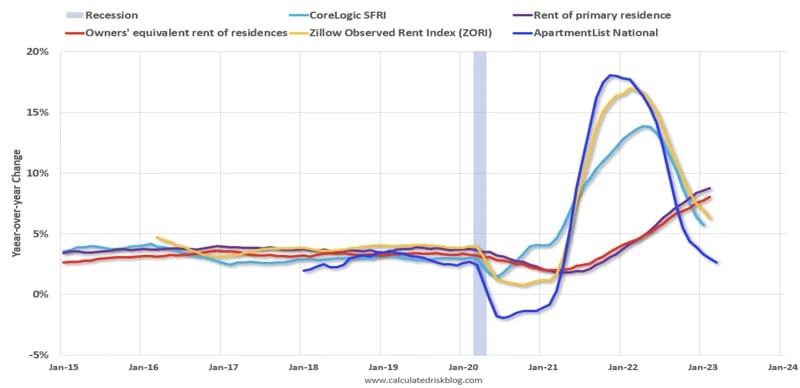
As of May 2023
All in all, the picture for the data dependent Fed is mixed, with hawks and doves each being able to point to data supportive of their positions. Markets believe the FOMC will opt to punt for now, by leaving rates where they are and revisit the issue when they next meet in late July.
Managed Income Strategy
The US High Yield sector experienced a slow eroding trend during the month of May. In response, the Managed Income Strategy reverted to a Risk-Off posture during the month. Overall, we continue to see rangebound activity in the high yield sector, which could result in a shift back to Risk-On for the Strategy if the downtrend fizzles out. In our Risk-Off allocation we remain reluctant to utilize US Treasuries as yields continue to rise, electing for cash equivalents which continue to provide meaningful yield as we await our next Risk-On opportunity.
Dynamic Growth Strategy
The Dynamic Growth Strategy entered the month of May Risk-On before retreating to Risk-Off on an overbought indication from the model. However, US equities continued to grind higher during the month, fueled by the promise of artificial intelligence, with semiconductors and other tech stocks leading the way. Should this momentum and low volatility continue, we would expect Dynamic Growth to rejoin the rally in progress.
Active Advantage Strategy
The Active Advantage strategy spent the month of May generally invested in a balanced Risk-On posture. During the month, the strategy was invested in a mix of investment grade credit, higher yielding fixed income, and equities. In late May, the strategy went to a full Risk-Off position, driven by deterioration in fixed income trends, coupled with overbought equity readings. As with the other strategies, we would anticipate Active Advantage would re-enter the markets, particularly on the equity side, should volatility remain low and upon reaching a confirmation of the equity trend.
Defender Strategy
Kensington recently launched its fourth investment offering, the Kensington Defender Strategy (“Defender”). Defender is a tactical global allocation strategy that seeks capital preservation and total return through both capital appreciation and income. The Strategy uses a momentum-based approach to tactically shift its allocation across twelve asset classes, including domestic and international equities, real assets including real estate, commodities and gold, and fixed income securities. Additionally, the Strategy will shift defensively, allocating a portion or all of the portfolio to cash and Treasuries when global momentum trends weaken. Entering June, the strategy is primarily allocated defensively, with minor allocations to US equities, developed international equities and gold.
1Also known as the Tokyo Stock Price Index, the TOPIX Index is a capitalization-weighted index of all companies listed on the First Section of the Tokyo Stock Exchange. The index is supplemented by the subindices of the 33 industry sectors.
2MSCI World Index is a widely followed global stock market index that tracks the performance of large and mid-cap companies across 23 developed countries.
3The S&P 500 is a stock index that tracks the share prices of 500 of the largest public companies in the United States.
4The Russell 2000 Index is a small-cap U.S. stock market index that makes up the smallest 2,000 stocks in the Russell 3000 Index.
5The Nasdaq 100 is a modified capitalization-weighted stock market index made up of 101 equity securities issued by 100 of the largest non-financial companies listed on the Nasdaq stock exchange The stocks' weights in the index are based on their market capitalizations, with certain rules capping the influence of the largest components.
6The 10-year Treasury note is a debt obligation issued by the United States government with a maturity of 10 years upon initial issuance.
7The Bloomberg U.S. Corporate Investment Grade Index is a broad-based benchmark that measures the investment grade, fixed-rate, taxable, corporate bond market.
8The Bloomberg US Mortgage Backed Securities (MBS) Index tracks fixed--rate agency mortgage backed passthrough securities guaranteed by Ginnie Mae (GNMA), Fannie Mae (FNMA), and Freddie Mac (FHLMC).
9The Bloomberg USD High-Yield Corporate Bond Index is a rules-based, market-value-weighted index that measures publicly issued non-investment grade UD fixed-rate, taxable and corporate bonds.
Investing involves risk. Principal loss is possible.
Risks specific to the Managed Income Strategy include Management Risk, High-Yield Risk, Fixed-Income Security Risk, Foreign Investment Risk, Loans Risk, Market Risk, Underlying Funds Risk, Non-Diversification Risk, Turnover Risk, U.S. Government Securities Risk, Interest Rate Risk, Models and Data Risk.
Risks specific to the Dynamic Growth Strategy include Management Risk, Equity Securities Risk, Market Risk, Underlying Funds Risk, Non-Diversification Risk, Small and Mid-Capitalization Companies Risk, Turnover Risk, U.S. Government Securities Risk, Models and Data Risk.
Risks specific to the Active Advantage Strategy include Management Risk, Equity Securities Risk, High-Yield Risk, Fixed- Income Security Risk, Foreign Investment Risk, Loans Risk, Market Risk, Underlying Funds Risk, Limited History of Operations Risk, Non-Diversification Risk, Small and Mid-Capitalization Companies Risk, Turnover Risk, U.S. Government Securities Risk, Interest Rate Risk, Models and Data Risk.
There is no guarantee that the investment objectives will be achieved. Moreover, the past performance is not a guarantee or indicator of future results. The investment return and principal value of an investment will fluctuate so that an investor’s shares, when redeemed, may be worth more or less than their original cost.
This is for informational purposes only and should not be construed as a solicitation to buy or sell, or to invest in any investment product or strategy. Investing in securities markets involves risk and the degree of risk varies by the type of investment or strategy. For a complete list of the risks associated with each of our Strategies, please review the Strategy Brochure and Factsheet. Materials such as blog posts, newsletters or commentary may contain information deemed to be correct and appropriate at a given time but may not reflect our current views or opinions due to changing market conditions. No information provided should be viewed as, or used as a substitute for individualized investment advice.
This document does not constitute advice or a recommendation or offer to sell or a solicitation to deal in any security or financial product. It is provided for information purposes only and on the understanding that the recipient has sufficient knowledge and experience to be able to understand and make their own evaluation of the proposals and services described herein, any risks associated therewith and any related legal, tax, accounting or other material considerations. To the extent that the reader has any questions regarding the applicability of any specific issue discussed above to their specific portfolio or situation, prospective investors are encouraged to contact the professional advisor of their choosing.
Certain information contained herein has been obtained from third party sources and such information has not been independently verified by Kensington Asset Management, LLC (“KAM”). No representation, warranty, or undertaking, expressed or implied, is given to the accuracy or completeness of such information by KAM or any other person. While such sources are believed to be reliable, KAM does not assume any responsibility for the accuracy or completeness of such information. KAM does not undertake any obligation to update the information contained herein as of any future date.
Any indices and other financial benchmarks shown are provided for illustrative purposes only, are unmanaged, reflect reinvestment of income and dividends and do not reflect the impact of advisory fees. Investors cannot invest directly in an index. Comparisons to indexes have limitations because indexes have volatility and other material characteristics that may differ from a particular strategy. For example, a strategy may typically hold substantially fewer securities than are contained in an index.
Certain information contained herein constitutes “forward-looking statements,” which can be identified by the use of forward-looking terminology such as “may,” “will,” “should,” “expect,” “anticipate,” “project,” “estimate,” “intend,” “continue,” or “believe,” or the negatives thereof or other variations thereon or comparable terminology. Due to various risks and uncertainties, actual events, results or actual performance may differ materially from those reflected or contemplated in such forward-looking statements. Nothing contained herein may be relied upon as a guarantee, promise, assurance or a representation as to the future.
Definitions:
Equity Securities Risk: The Fund may invest in or have exposure to equity securities. Equity securities may experience sudden, unpredictable drops in value or long periods of decline in value. This may occur because of factors that affect securities markets generally or factors affecting specific industries, sectors, geographic markets, or companies in which the Fund invests.
Fixed-Income Security Risk: The Fund may invest in or have exposure to fixed-income securities. Fixed-income securities are or may be subject to interest rate, credit, liquidity, prepayment and extension risks. Interest rates may go up resulting in a decrease in the value of fixed-income securities. Credit risk is the risk that an issuer will not make timely payments of principal and interest. There is also the risk that an issuer may “call,” or repay, its high yielding bonds before their maturity dates. Fixed-income securities subject to prepayment can offer less potential for gains during a declining interest rate environment and similar or greater potential for loss in a rising interest rate environment. Limited trading opportunities for certain fixed-income securities may make it more difficult to sell or buy a security at a favorable price or time. Changes in market conditions and government policies may lead to periods of heightened volatility and reduced liquidity in the fixed income securities market, and could result in an increase in redemptions. Interest rate changes and their impact on a fund and its share price can be sudden and unpredictable.
Foreign Investment Risk: Foreign investments may be riskier than U.S. investments for many reasons, such as changes in currency exchange rates and unstable political, social, and economic conditions.
High-Yield Risk: Lower-quality fixed income securities, known as “high-yield” or “junk” bonds, present greater risk than bonds of higher quality, including an increased risk of default. These securities are considered speculative. Defaulted securities or those subject to a reorganization proceeding may become worthless and are illiquid.
LIBOR Risk: Changes related to the use of the London Interbank Offered Rate (LIBOR) or similar interbank offered rates (“IBORs,” such as the Euro Overnight Index Average (EONIA)) could have adverse impacts on financial instruments that reference LIBOR or a similar rate. While some instruments may contemplate a scenario where LIBOR or a similar rate is no longer available by providing for an alternative rate setting methodology, not all instruments have such fallback provisions and the effectiveness of replacement rates is uncertain. The abandonment of LIBOR and similar rates could affect the value and liquidity of instruments that reference such rates, especially those that do not have fallback provisions. The use of alternative reference rate products may impact investment strategy performance.
Limited History of Operations Risk: The Fund has a limited history of operations for investors to evaluate. The Fund may fail to attract sufficient assets to operate efficiently.
Loans Risk: The market for loans, including bank loans, loan participations, and syndicated loan assignments may not be highly liquid, and the holder may have difficulty selling them. These investments expose the Fund to the credit risk of both the financial institution and the underlying borrower. Bank loans settle on a delayed basis, which can be greater than seven days, potentially leading to the sale proceeds of such loans not being available for a substantial period of time after the sale of the bank loans.
Management Risk: The Adviser’s reliance on its proprietary trend-following model and the Adviser’s judgments about the attractiveness, value, and potential appreciation of particular assets may prove to be incorrect and may not produce the desired results.
Market Risk: Overall investment market risks affect the value of the Fund. Factors such as economic growth and market conditions, interest rate levels, and political events affect U.S. and international investment markets. Additionally, unexpected local, regional or global events, such as war; acts of terrorism; financial, political or social disruptions; natural, environmental or man-made disasters; the spread of infectious illnesses or other public health issues (such as the global pandemic coronavirus disease 2020 (COVID-19)); and recessions and depressions could have a significant impact on the Fund and its investments and may impair market liquidity. Such events can cause investor fear, which can adversely affect the economies of nations, regions and the market in general, in ways that cannot necessarily be foreseen.
Models and Data Risk: The Fund’s investment exposure is heavily dependent on proprietary quantitative models as well as information and data supplied by third parties (“Models and Data”). When Models and Data prove to be incorrect or incomplete, any decisions made in reliance thereon may lead to securities being included in or excluded from the Fund’s portfolio that would have been excluded or included had the Models and Data been correct and complete. Some of the models used by the Fund are predictive in nature. The use of predictive models has inherent risks. For example, such models may incorrectly forecast future behavior, leading to potential losses. In addition, in unforeseen or certain low-probability scenarios (often involving a market disruption of some kind), such models may produce unexpected results, which can result in losses for the Fund.
Non-Diversification Risk: As a non-diversified fund, the Fund may invest more than 5% of its total assets in the securities of one or more issuers. The Fund also invests in underlying funds that are non-diversified. The Fund’s performance may be more sensitive to any single economic, business, political or regulatory occurrence than the value of shares of a diversified investment company.
Small and Mid-Capitalization Companies Risk: Investing in or having exposure to the securities of small-capitalization and mid-capitalization companies involves greater risks and the possibility of greater price volatility than investing in larger capitalization and more-established companies. Investments in mid-cap companies involve less risk than investing in small cap companies. Smaller companies may have limited operating history, product lines, and financial resources, and the securities of these companies may lack sufficient market liquidity. Mid-cap companies often have narrower markets and more limited managerial and financial resources than larger, more established companies.
Turnover Risk: A higher portfolio turnover may result in higher transactional and brokerage costs. The Fund’s portfolio turnover rate may be significantly above 100% annually
Underlying Funds Risk: Investments in underlying funds involve duplication of investment advisory fees and certain other expenses. Each underlying fund is subject to specific risks, depending on the nature of its investment strategy. The manager of an underlying fund may not be successful in implementing its strategy. ETF shares may trade at a market price that may be lower (a discount) or higher (a premium) than the ETF’s net asset value. ETFs are also subject to brokerage and/or other trading costs, which could result in greater expenses to the Fund. Because the value of ETF shares depends on the demand in the market, the Adviser may not be able to liquidate the Fund’s holdings at the most optimal time, adversely affecting performance.
U.S. Government Securities Risk: The Fund may invest directly or indirectly in obligations issued by agencies and instrumentalities of the U.S. government. The U.S. government may choose not to provide financial support to U.S. government sponsored agencies or instrumentalities if it is not legally obligated to do so, in which case, if the issuer defaulted, the Fund might not be able to recover its investment.
Advisory services offered through Kensington Asset Management, LLC.