


by Craig Love, on June 15, 2023
Kensington Market Insights - June 15
Market Insights is a weekly piece in which Kensington’s Portfolio Management team will share interesting and thought-provoking charts that we believe provide insight into markets and the current investment landscape.
High Yield in Focus
The high yield bond asset class has been trading in a tight range dating back to July 2022, with virtually all of its performance stemming from yield, rather than price appreciation (below). This tight trading range is uncommon and suggests a potential breakout coming, one direction or another.
Yesterday, the Federal Reserve announced they would maintain the Federal Funds rate at 5.00-5.25% for June, following ten consecutive rate hikes over the span of 16 months. Let’s examine what high yield bonds have done historically following a Fed pause and what other factors may impact the asset class in the coming months.
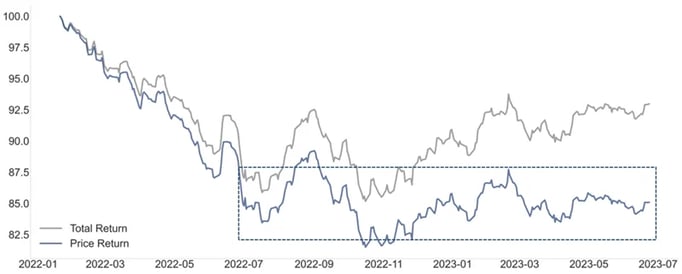
Source: Bloomberg US Corporate High Yield Index (LF98TRUU)
If History is Any Indicator
Historically, high yield bonds have performed well following a pause in rate hikes. According to a note from JPMorgan’s strategist Nelson Jantzen on Tuesday, there were five instances in the last 30 years where Fed policy transitioned to a pause, which lasted an average of 10 months until the onset of the first rate cut.
During those periods high yield provided an average of 6- and 12-month total returns of +6.4% and +12.3% respectively. In four of the five instances, high yield provided double- digit returns year-over-year, including 14.1% following December 2018’s pause, JPMorgan noted. If history is any indicator, we may be in store for a positive break out for high yield prices as yields begin to decrease.
This Time it’s Different?
While the historical precedent is encouraging, there are several factors that distinguish the current regime from prior pauses, which may create headwinds for the asset class, at least initially. This time the yield curve is inverted, inflation remains high, recession still appears likely, labor markets are tight and so are bank lending conditions. When combined, these factors present a fairly unique scenario compared to past pauses and may pose difficulties for those advocating a bullish stance. In order to gain a deeper understanding of the potential impact, let's explore how these factors have historically influenced high-yield bonds.
Recession
Bankrate's First-Quarter Economic Indicator Survey from April 2023 indicates a 64% chance of a US recession. While the likelihood of a recession has been considered high for several months, recent bank failures and the resulting instability in the financial system have further increased the downside risks for the economy.
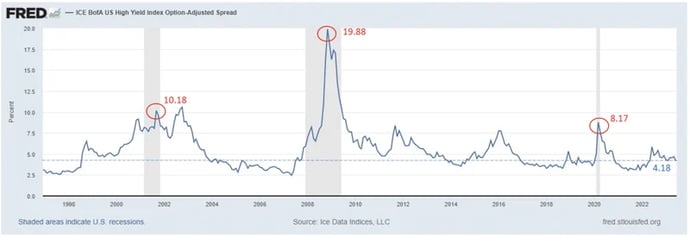
To gain insight into the potential impact, let's examine the trends observed during the last three US recessions (chart below). In each of these cases, the US High Yield Option Adjusted Spread, which represents the difference between high-yield rates and treasury rates, exceeded 800 basis points. During the Great Financial Crisis, this spread even reached almost 2000 basis points.
However, as of Tuesday, the spread currently sits below its historical average at 4.18 and has been steadily declining since early May. If a recession does occur, it is likely that we will see an expansion in spreads, which would put downward pressure on high-yield bond prices.
Bank Lending Standards
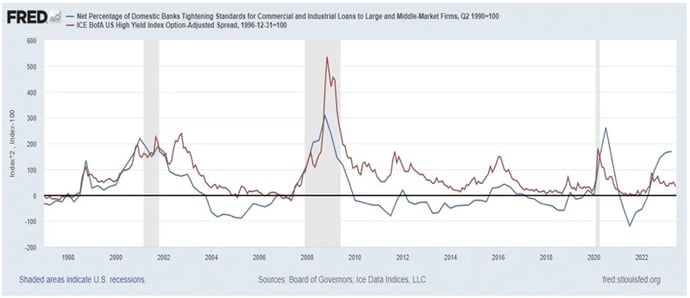
One contributing factor to the elevated probability of a US recession is the tightening of bank lending standards. As previously mentioned, bank lending plays a vital role in fueling the US economy, and if companies are unable to secure loans, it can stifle growth and further hinder the already stagnant GDP growth. In the aftermath of recent bank failures, there has been a notable surge in lending standards. As you can see from the chart below, dating back to 1998, every instance of substantial bank tightening has coincided with a recession. Furthermore, in the context of high-yield bonds, this tightening has also been accompanied by a significant widening of spreads.
A primary reason why these data sets are correlated is that when banks start tightening standards, it typically coincides with increases in default rates for lower graded bonds, something we are already witnessing today. According to a recent report from Goldman Sachs, there were 18 debt defaults in the US loan market between January 1 and the end of May totaling $21bn — greater in number and total value than for the whole of 2021 and 2022 combined. May alone saw three defaults totaling $7.8bn — the highest monthly dollar amount since the depths of the Covid-19 crisis three years ago (chart below). If defaults continue to mount, a rise in rates (and drop in prices) is likely to occur for high yield bonds.
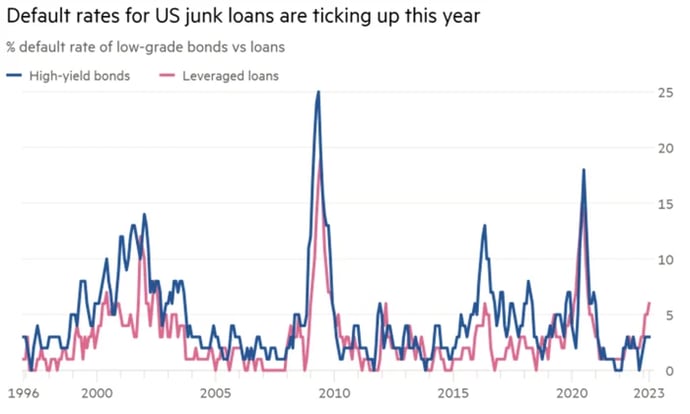
Source: Financial Times
Where Do We Go From Here?
Regardless of whether we observe a positive impact resulting from a Federal Reserve pause or a negative impact due to a potential recession, one thing is certain: something must change in the high-yield bond market. The current effective yield for the ICE BofA US High Yield Index sits at 8.36% and has consistently remained above 8% dating back to June 2022. Companies, particularly lower credit quality companies, cannot sustainably borrow at these rates, meaning either yields need to decrease to more sustainable levels or a credit dislocation event will occur, elevating spreads before a reset can occur.
The encouraging news is that both of these scenarios can present meaningful opportunities, particularly for tactical high-yield investors. If yields decrease as the Federal Reserve adjusts its stance and lowers rates, there is a potential for substantial price appreciation, similar to previous periods of Fed pauses. On the other hand, if high-yield spreads expand, it can create an exceptional buying opportunity, as seen in 2009 when spreads reached almost 20%. That year, the ICE BofA US High Yield Index posted a remarkable return of 57.51% and emerged as the best-performing asset class.
In either scenario, significant opportunities seem to lie ahead for high-yield investors who can adeptly navigate the rapidly evolving landscape.
Forward-looking statements are based on management’s then current views and assumptions and, as a result, are subject to certain risks and uncertainties that could cause actual results to differ materially from those projected. This market insight is for informational purposes only and should not be construed as a solicitation to buy or sell, or to invest in any investment product or strategy. Investing involves risk including loss of principal.
Disclaimer
Risks specific to the Managed Income Strategy include Management Risk, High-Yield Risk, Fixed-Income Security Risk, Foreign Investment Risk, Loans Risk, Market Risk, Underlying Funds Risk, Non-Diversification Risk, Turnover Risk, U.S. Government Securities Risk, LIBOR Risk, Models and Data Risk.
Risks specific to the Dynamic Growth Strategy include Management Risk, Equity Securities Risk, Market Risk, Underlying Funds Risk, Non-Diversification Risk, Small and Mid-Capitalization Companies Risk, Turnover Risk, U.S. Government Securities Risk, Models and Data Risk.
Risks specific to the Active Advantage Strategy include Management Risk, Equity Securities Risk, High-Yield Risk, Fixed-Income Security Risk, Foreign Investment Risk, Loans Risk, Market Risk, Underlying Funds Risk, Limited History of Operations Risk, Non-Diversification Risk, Small and Mid-Capitalization Companies Risk, Turnover Risk, U.S. Government Securities Risk, LIBOR Risk, Models and Data Risk.
Past performance is not indicative of future returns and the value of the investments and the income derived from them can go down as well as up. Future returns are not guaranteed and a loss of principal may occur. There is no guarantee any investment strategy will generate a profit or prevent a loss. Investing in securities involves risk, including loss of principal.
The types of securities held by a comparison benchmark may be substantially different from the investment strategy. An investor should consider the investment objectives, risks, charges, and expenses of the investment and the strategy carefully before investing. The S&P 500 TR Index is a capitalization weighted index of 500 stocks representing all major domestic industry groups. The S&P 500 TR Index assumes the reinvestment of dividends and capital gains. It is not possible to invest in an index, and index returns do not include management fees. The Bloomberg U.S. Aggregate Bond Index is a market capitalization-weighted intermediate term index which tracks the performance of investment grade rated debt publicly traded in the United States. It is not possible to invest directly in an index.
Investment returns will be reduced by advisory fees and other expenses charged in the management of a client’s account. You should understand how ongoing advisory fees, compounded over a number of years, reduce the value of your investment portfolio, as investment balances and potential gains on the investment balances are reduced by fees. Additional information is provided in the SEC Investors Bulletin “How Fees and Expenses Affect Your Investment Portfolio.”