


by Craig Love, on June 29, 2023
Kensington Market Insights - June 29
Market Insights is a weekly piece in which Kensington’s Portfolio Management team will share interesting and thought-provoking charts that we believe provide insight into markets and the current investment landscape.
VIX: The “Nothing to Fear” Index?
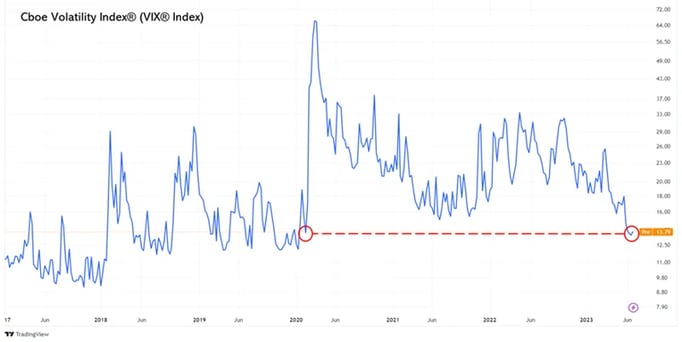
In February, we discussed how the rise of zero days to expiration (0DTE) options may impact the dependability of the Cboe Volatility Index (VIX), which is commonly regarded as a proxy to gauge market volatility and investors' views on volatility. While it's uncertain whether its reliability has been impacted, the VIX can still provide interesting insights into the market. Despite the VIX currently sitting at its lowest level since before COVID, hitting a low of just 12.94 on June 22nd, there are signs that the "Fear Index" may soon be on the rise.
S&P 500 Correlation
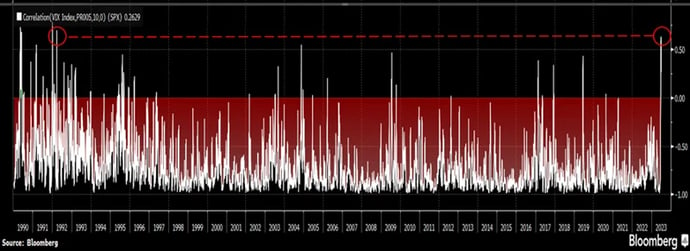
The VIX Index has historically demonstrated a negative correlation to the S&P 500 (SPX), which intuitively makes sense. When equity markets move down, one would expect volatility, or at least the expectation for volatility, to move up, creating an inverse relationship between equities and the VIX. The historical average is a -0.76 correlation, demonstrating a very high negative correlation to each other. However, as of June 23rd, the 10-day rolling correlation between the VIX and SPX sits at 0.61 (chart below). This level of positive correlation is rare, not having occurred since 1992. Historically, when the correlation between the two spikes, it signifies a short-term peak in the market.
VIX Futures Spread to Spot
Another rarity for the VIX can be seen in the futures market, where the spread between the highest VIX futures contract and the current spot price is currently at 63% (below). This, too, is rare, having occurred just four times since 2018, but preceded a major market pullback in each of the three previous instances.
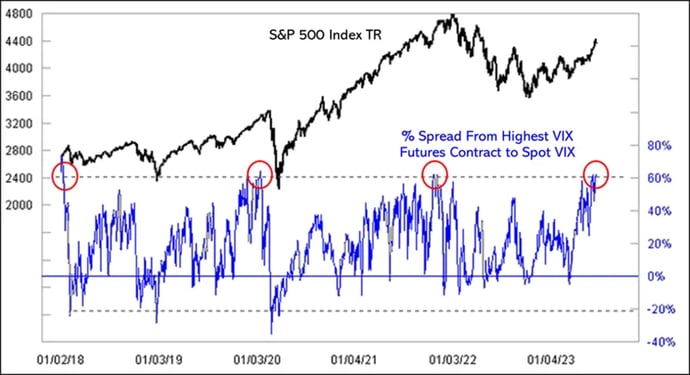
Source: McClellan Financial
Seasons Change
Another factor that may influence a rise in the VIX is simply seasonality. As seen in the chart below, the VIX has historically slumped into July before rising through the 3rd quarter. While this year's drop has been more dramatic than the historical norm, it has been following a common seasonal pattern which, if it stays consistent, could result in a sharp increase in the coming months.
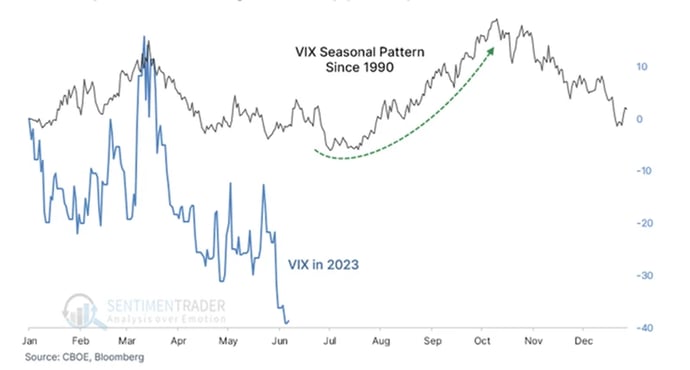
Source: Financial Times
Call Option Interest
Traders are certainly taking notice. According to Cboe Global Markets data (below), more call options tied to the VIX have changed hands on an average day in June than in any other month on record. This could be a result of the current cheapness of these options, but buyers of these options may be looking to take advantage of what may be an imminent rise in the VIX.
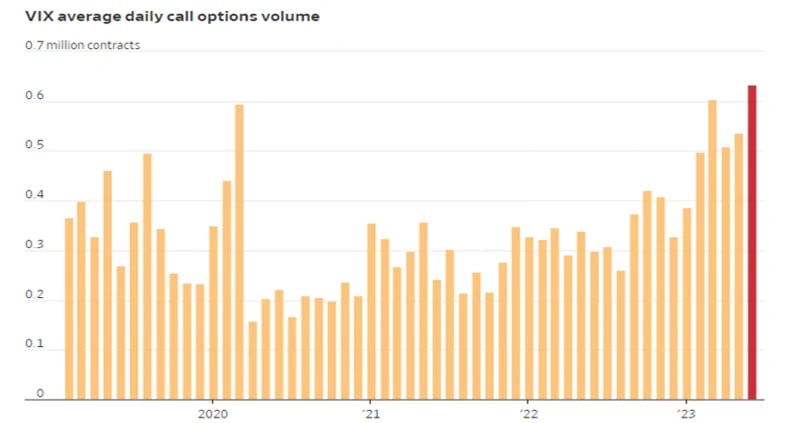
Source: CBOE Global Markets
Whether or not any of these statistical anomalies are meaningful or just coincidental, it does seem markets have been more subdued than the global landscape would suggest. The Fed continues to raise rates in the face of inflation, geopolitical tensions remain heightened and corporate earnings have been negative for two quarters in a row. Yet, it has now been more than three months since the S&P 500 has pulled back at least 3%, one of the longest such stretches since World War II, according to Deutsche Bank. The average weekly move for the benchmark has been less than 1% in either direction since the end of March, according to FactSet. In late 2022, the index averaged swings of roughly 2.6% each week. This may soon change, and investors should not get lulled into complacency as markets can shift quickly, and the ability to shift exposures remains as important as ever.
Forward-looking statements are based on management’s then current views and assumptions and, as a result, are subject to certain risks and uncertainties that could cause actual results to differ materially from those projected. This market insight is for informational purposes only and should not be construed as a solicitation to buy or sell, or to invest in any investment product or strategy. Investing involves risk including loss of principal.