


by Craig Love, on July 24, 2023
Kensington Monthly Market Commentary: June 2023
Geopolitics: The Russia-Ukraine conflict recently passed the 500-day mark with both sides further entrenching themselves in battle amid little signs of immediate progress. At the same time, domestic pressure on Putin is increasing as the stalemate lingers, with casualties increasing and few signs of progress. This pressure was nowhere more evident than in the putsch staged by the Wagner mercenary group and its head Yevgeniy Prigozhin. While seemingly nothing of note came from the contretemps – Putin forgave and said it was all a misunderstanding - it was shocking to most experienced onlookers how public the aborted mutiny was and Putin’s almost conciliatory steps to end it. In the meantime, the West agreed to deliver cluster munitions, long-range missiles, tanks and vehicles to the Ukraine, while holding off on extending an outright invitation to join NATO so as to minimize the risk of Russia escalating the conflict beyond the current theater. In retaliation, Russia halted the Black Sea grain deal that allows grain to flow from Ukraine to countries in Africa, the Middle East and Asia where hunger and high food prices are a growing security threat as more people find themselves pushed into poverty.
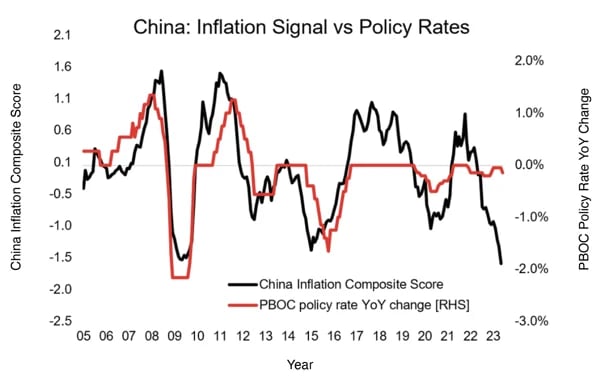
Switching to China, the country continues to struggle economically, as it deals with structural imbalances in the form of an over-leveraged real estate sector and weak consumer demand on top of slowing export growth. Richard Koo, the highly regarded economist who coined the phrase “balance sheet recession” back in the 1990s, when describing the travails of Japan’s economy after its stock market bubble burst leading to years of sub-par growth, has recently said China is suffering from a similar malady: the enormous amount of debt taken on during the country’s real estate boom years is now acting as a significant drain on private demand as loan principal and interest is either repaid or canceled. Because of this, Koo is suggesting the Chinese government quickly step in and implement aggressive monetary and fiscal measures to stimulate demand or risk a repeat of Japan’s lost decade. China is in a fortunate position to do exactly this as inflation is falling rapidly (see chart below). At the same time, however, authorities are increasingly concerned about the weakness in the Yuan, so any policies to stimulate the economy must consider the impact on an already sliding currency. All this has been reflected in the relatively poor performance by China’s stock markets in the first half of 2023, with the Shanghai Composite Index gaining a lackluster 3.7%.
Stock Market: Stocks rallied strongly in June with all the major indices registering mid single-digit gains: the Nasdaq 1001 and S&P 5002 nearly matched each other, up 6.49% and 6.47% respectively. For the first time in many months, the Russell 2000 Small Cap Index3 outperformed the large-cap indices, gaining 7.95%. Overseas bourses didn’t fare quite as well with the MSCI EAFE Index4 advancing 3.6% and the EURO STOXX 505 gaining 4.29%.
The strength in equities was due in large part to better than expected economic reports juxtaposed with an inflation backdrop that, while still elevated, is trending very much in the right direction. The ISM Services Purchasing Managers Index6 rebounded in June to 53.9, the strongest reading in four months and well above forecasts. Core PCE, the Federal Reserve’s preferred measure of inflation, rose 4.6% YoY in May, far higher than their long-term target of 2% but still lower than consensus expectations of 4.7%.
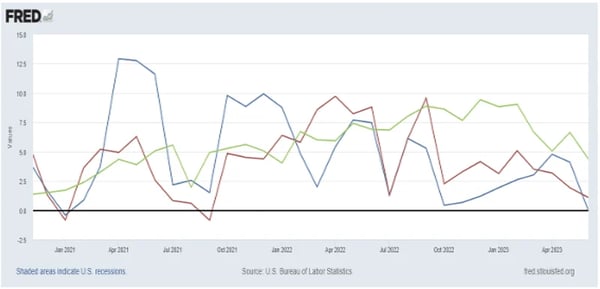
Looking at more recent inflation data, however, the picture is much brighter. If one were to take the latest month’s Core-CPI report and annualize it, inflation actually came in at 1.9%, below the Fed's 2% target for the first time since February 2021. Shelter inflation, which comprises 44% of Core-CPI, tends to lag changes in housing costs and is serving to inflate current overall inflation readings. If we were to remove these costs – which remain elevated at 4.4% - entirely from Core-CPI to obtain "super core" inflation, we can see in the graph below prices in the overall economy are actually experiencing a small deflation of 0.02% (m/m, annualized), the first such decline since January 2021.
"Super core" (blue), Core Services, ex-Shelter (red), and Shelter (green) (m/m, ann.)
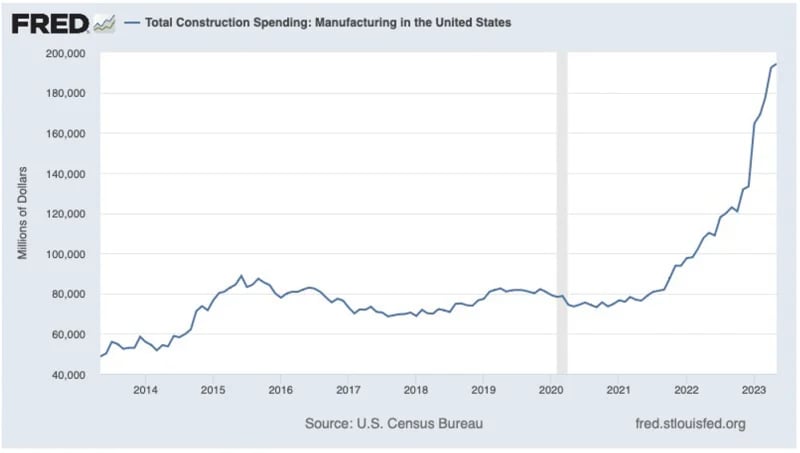
One interesting data point accounting for why so many have wrongly called for a recession in the first half of 2023 is provided by the chart below. The stimulative impact of fiscal policy as seen in programs such as the Inflation Reduction Act has led to a boom in nonresidential investment, especially manufacturing. Together with government policies designed to encourage the on-shoring of American business, the result has been a boost to GDP growth even in the face of much higher interest rates and a slowdown in bank lending.
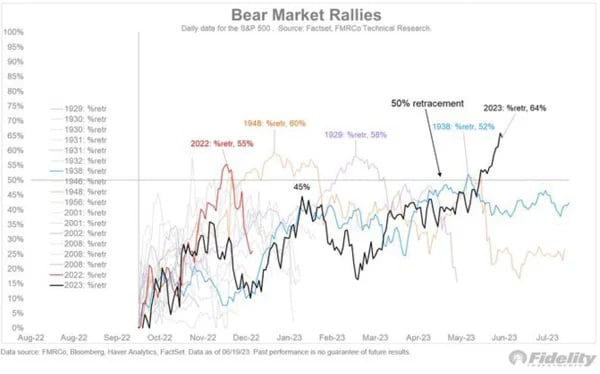
Many investors are now wondering if we’re still in the bear market that began in 2022 or if we should characterize the current market as a new bull. As shown in the graph below bear-market rallies generally do not retrace more than half of their preceding declines. As of June 30, 2023, the S&P 500 cap-weighted index has retraced approximately 65% of the 2022 decline, exceeding all previous bear-market rallies since the 1920s. From a purely technical standpoint, it’s becoming more and more evident October 2022 marked the bottom of the bear market.
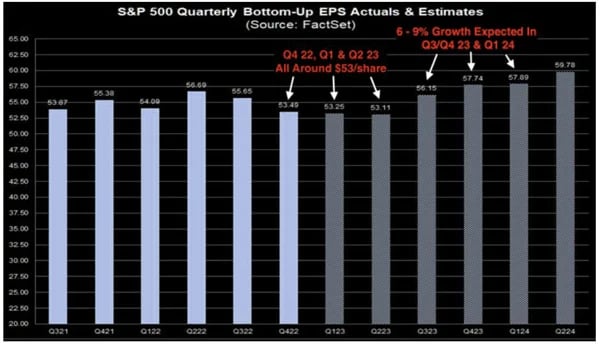
Looking forward, Q2 earnings season is upon us and it will be an important one as we now are some 15 months from the start of the Fed’s monetary tightening program. History indicates the impact of major tightening programs generally evidences itself 15-18 months out, so the drag on corporate earnings should start to show up beginning now. Of course, analysts’ earnings forecasts have adjusted accordingly with Q2 earnings expected to drop 8% year over year, but it is here where bulls and bears part company. Bulls believe earnings will begin rebounding in Q3 while bears believe earnings will continue declining in the last two quarters of 2023 leading to a retracement in overall markets. Corporate guidance provided by management for the rest of the year will be especially meaningful as a result.
Fixed Income: In contrast to the stock market, fixed income indices were mixed in June as interest rates moved higher. The benchmark 10-year Treasury lost -1.15%, the 5-year Treasury declined -1.32% while investment grade corporate credit fell -0.36%. At the same time, more credit sensitive sectors such as high yield and leveraged loans outperformed, with the Bloomberg High Yield Index7 gaining 1.67% and lower quality indices performing even better.
Credit spreads continued their downward trend in June. Since peaking in March in the midst of the regional banking crisis, high yield spreads have come in close to 100 basis points and are approaching the lows in this cycle. Normally this long into a Fed tightening cycle, these spreads would be expected to widen in anticipation of a more difficult business environment ahead. However, spreads have done just the opposite, correctly signaling it is not yet time to worry about a hard landing in the economy.
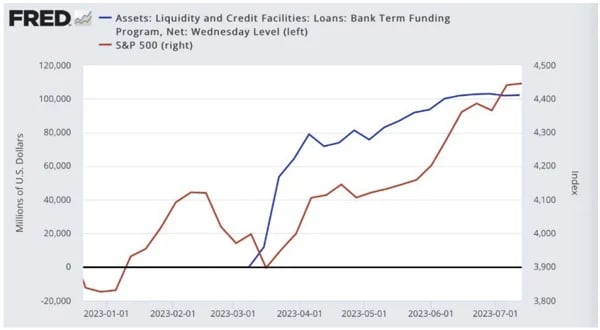
Part of the reason for lower grade credits’ outperformance can be attributed to the Federal Reserve and the initiatives it put in place during the aforementioned banking crisis. In order to stop a run on small and regional banks due to depositors’ fears about the health of these banks’ capital bases, the Fed agreed to effectively swap cash for the deeply underwater fixed income securities held in these banks’ portfolios. This re-liquified banks and together with the large Treasury’s General Account refunding going better than expected, was very supportive of corporate credit and asset classes in general.
The Federal Reserve and Monetary Policy: The Federal Open Market Committee (“FOMC”) paused their rate hiking program in June, with the rationale policy measures were beginning to take hold to slow inflation in the economy, plus a recognition the recent banking crisis might result in a pull back on lending acting to slow the economy further.
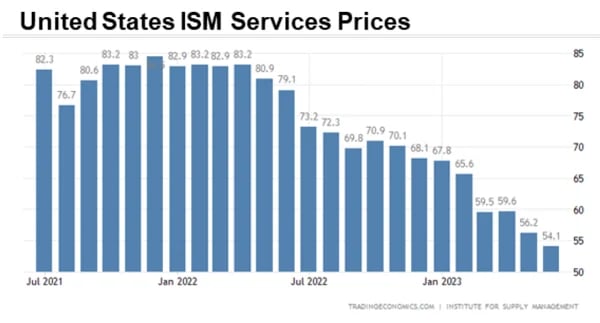
Chairman Powell took pains to point out this pause was temporary and the FOMC would act to raise rates again if recent gains in reducing inflation were reversed. Here the news on both the consumer and industrial side of the economy has been encouraging. Of particular note are the ISM Purchasing Managers Index prices paid sub-indexes. While prices have been dropping over the past year on the manufacturing side of the economy, it’s only been relatively recently we have seen a noticeable slowdown in prices paid in the service sector, which is particularly welcome news given the dominant role services play in the overall U.S. economy.
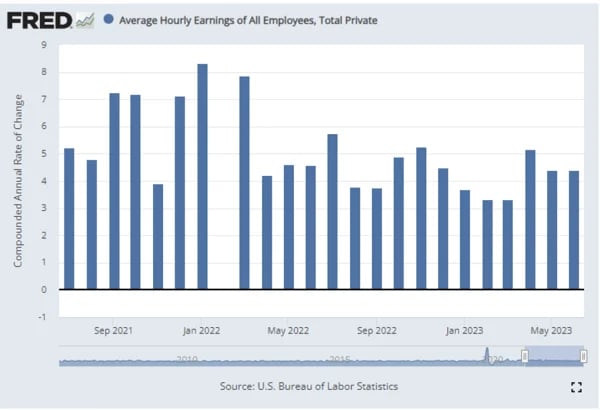
At the same time prices are declining, consumer spending continues to be fairly healthy bolstered by strong wages. The average hourly earnings of employees grew 4.4% YoY in June, the same pace as in May, and disposable personal income growth posted a solid 8% YoY.
Managed Income Strategy
As we noted last month, the US High Yield sector has recently been exhibiting rangebound activity. After a downtrend during the middle of the month, the sector began a strong positive trend, which was enough to bring the Managed Income model back to a “Risk-On” position at the conclusion of the month. In response to the “Risk-On” signal, the portfolio has been repositioned to include predominantly US High Yield, but also holds some diversifying positions, such as floating rate debt and investment grade corporate debt. We are encouraged that the high yield market could show further gains in the near term. Nevertheless, we remain vigilant and if prices reverse course, we will not hesitate to switch to a “Risk-Off” status if conditions warrant.
Dynamic Growth Strategy
Continued up trends across the equity markets, coupled with lower relative volatility, produced a “Risk- On” signal for Dynamic Growth very early in the month, and the Strategy remained positioned in a fully-invested position at month end as equity markets remained strong across the board. For the first time since the bear market began in late 2021, there are signs of broadening strength in equites. That’s an indication that the recovery that has been underway for the last few months could have further staying power. If so, Dynamic Growth should continue to benefit. The possibility of recession and higher interest rates in the medium to long term cannot be ruled out, but if a reversal of market conditions occurs, we will rely on the strategy’s “Risk-Off” metrics to go to a defensive position.
Active Advantage Strategy
The Active Advantage Strategy spent the month of June invested primarily in an opportunistic position, with approximately 20% of the portfolio invested in Nasdaq index instruments, with the remainder in cash. During the month, equities continued to rally, while fixed income remained rangebound. However, toward the end of the month, Active Advantage added on investment in US High Yield, at an approximate weighting of 20%. This resulted in a cash position of approximately 60% at the end of the month. Subsequent to the end of the month, the Active Advantage Strategy added incremental exposure, resulting in a fully invested position. As of this writing, Active Advantage is positioned in a more traditional “balanced” portfolio, with approximately 60% in equities and 40% in fixed income.
Defender Strategy
As discussed last month, Kensington recently launched its fourth investment offering, the Kensington Defender Strategy (“Defender”). Defender is a tactical global allocation strategy that seeks capital preservation and total return through both capital appreciation and income. The Strategy uses a momentum-based approach to tactically shift its allocation across twelve asset classes, including domestic and international equities, real assets including real estate, commodities and gold, and fixed income securities. Additionally, the Strategy will shift defensively, allocating a portion or all of the portfolio to cash and Treasuries when global momentum trends weaken. Entering July, the Strategy increased its overall market exposure on strong global trends and maintains allocations across domestic, international and emerging market equities as well as gold.
1The Nasdaq-100 is a stock market index made up of 101 equity securities issued by 100 of the largest non-financial companies listed on the Nasdaq stock exchange.
2The S&P 500 is a stock market index tracking the stock performance of 500 of the largest companies listed on stock exchanges in the United States.
3The Russell 2000 Small Cap Index makes up the smallest 2,000 stocks in the Russell 3000 Index.
4The MSCI EAFE Index is a stock market index that is designed to measure the equity market performance of developed markets outside of the U.S. & Canada.
5The EURO STOXX 50 is a stock index of 50 stocks from 11 countries in the Eurozone.
6The ISM Services Purchasing Managers Index is a monthly survey of the U.S. manufacturing firms that measures the level of economic activity and demand for products. It is a leading indicator of the state of the U.S. economy and the health of the manufacturing sector.
7The Bloomberg High Yield Index is a measure of the performance of high yield corporate bonds.
Investing involves risk. Principal loss is possible.
Risks specific to the Managed Income Strategy include Management Risk, High-Yield Risk, Fixed-Income Security Risk, Foreign Investment Risk, Loans Risk, Market Risk, Underlying Funds Risk, Non-Diversification Risk, Turnover Risk, U.S. Government Securities Risk, Interest Rate Risk, Models and Data Risk.
Risks specific to the Dynamic Growth Strategy include Management Risk, Equity Securities Risk, Market Risk, Underlying Funds Risk, Non-Diversification Risk, Small and Mid-Capitalization Companies Risk, Turnover Risk, U.S. Government Securities Risk, Models and Data Risk.
Risks specific to the Active Advantage Strategy include Management Risk, Equity Securities Risk, High-Yield Risk, Fixed- Income Security Risk, Foreign Investment Risk, Loans Risk, Market Risk, Underlying Funds Risk, Limited History of Operations Risk, Non-Diversification Risk, Small and Mid-Capitalization Companies Risk, Turnover Risk, U.S. Government Securities Risk, Interest Rate Risk, Models and Data Risk.
There is no guarantee that the investment objectives will be achieved. Moreover, the past performance is not a guarantee or indicator of future results. The investment return and principal value of an investment will fluctuate so that an investor’s shares, when redeemed, may be worth more or less than their original cost.
This is for informational purposes only and should not be construed as a solicitation to buy or sell, or to invest in any investment product or strategy. Investing in securities markets involves risk and the degree of risk varies by the type of investment or strategy. For a complete list of the risks associated with each of our Strategies, please review the Strategy Brochure and Factsheet. Materials such as blog posts, newsletters or commentary may contain information deemed to be correct and appropriate at a given time but may not reflect our current views or opinions due to changing market conditions. No information provided should be viewed as, or used as a substitute for individualized investment advice.
This document does not constitute advice or a recommendation or offer to sell or a solicitation to deal in any security or financial product. It is provided for information purposes only and on the understanding that the recipient has sufficient knowledge and experience to be able to understand and make their own evaluation of the proposals and services described herein, any risks associated therewith and any related legal, tax, accounting or other material considerations. To the extent that the reader has any questions regarding the applicability of any specific issue discussed above to their specific portfolio or situation, prospective investors are encouraged to contact the professional advisor of their choosing.
Certain information contained herein has been obtained from third party sources and such information has not been independently verified by Kensington Asset Management, LLC (“KAM”). No representation, warranty, or undertaking, expressed or implied, is given to the accuracy or completeness of such information by KAM or any other person. While such sources are believed to be reliable, KAM does not assume any responsibility for the accuracy or completeness of such information. KAM does not undertake any obligation to update the information contained herein as of any future date.
Any indices and other financial benchmarks shown are provided for illustrative purposes only, are unmanaged, reflect reinvestment of income and dividends and do not reflect the impact of advisory fees. Investors cannot invest directly in an index. Comparisons to indexes have limitations because indexes have volatility and other material characteristics that may differ from a particular strategy. For example, a strategy may typically hold substantially fewer securities than are contained in an index.
Certain information contained herein constitutes “forward-looking statements,” which can be identified by the use of forward-looking terminology such as “may,” “will,” “should,” “expect,” “anticipate,” “project,” “estimate,” “intend,” “continue,” or “believe,” or the negatives thereof or other variations thereon or comparable terminology. Due to various risks and uncertainties, actual events, results or actual performance may differ materially from those reflected or contemplated in such forward-looking statements. Nothing contained herein may be relied upon as a guarantee, promise, assurance or a representation as to the future.
Definitions:
Equity Securities Risk: The Fund may invest in or have exposure to equity securities. Equity securities may experience sudden, unpredictable drops in value or long periods of decline in value. This may occur because of factors that affect securities markets generally or factors affecting specific industries, sectors, geographic markets, or companies in which the Fund invests.
Fixed-Income Security Risk: The Fund may invest in or have exposure to fixed-income securities. Fixed-income securities are or may be subject to interest rate, credit, liquidity, prepayment and extension risks. Interest rates may go up resulting in a decrease in the value of fixed-income securities. Credit risk is the risk that an issuer will not make timely payments of principal and interest. There is also the risk that an issuer may “call,” or repay, its high yielding bonds before their maturity dates. Fixed-income securities subject to prepayment can offer less potential for gains during a declining interest rate environment and similar or greater potential for loss in a rising interest rate environment. Limited trading opportunities for certain fixed-income securities may make it more difficult to sell or buy a security at a favorable price or time. Changes in market conditions and government policies may lead to periods of heightened volatility and reduced liquidity in the fixedincome securities market, and could result in an increase in redemptions. Interest rate changes and their impact on a fund and its share price can be sudden and unpredictable.
Foreign Investment Risk: Foreign investments may be riskier than U.S. investments for many reasons, such as changes in currency exchange rates and unstable political, social, and economic conditions.
High-Yield Risk: Lower-quality fixed income securities, known as “high-yield” or “junk” bonds, present greater risk than bonds of higher quality, including an increased risk of default. These securities are considered speculative. Defaulted securities or those subject to a reorganization proceeding may become worthless and are illiquid.
LIBOR Risk: Changes related to the use of the London Interbank Offered Rate (LIBOR) or similar interbank offered rates (“IBORs,” such as the Euro Overnight Index Average (EONIA)) could have adverse impacts on financial instruments that reference LIBOR or a similar rate. While some instruments may contemplate a scenario where LIBOR or a similar rate is no longer available by providing for an alternative rate setting methodology, not all instruments have such fallback provisions and the effectiveness of replacement rates is uncertain. The abandonment of LIBOR and similar rates could affect the value and liquidity of instruments that reference such rates, especially those that do not have fallback provisions. The use of alternative reference rate products may impact investment strategy performance.
Limited History of Operations Risk: The Fund has a limited history of operations for investors to evaluate. The Fund may fail to attract sufficient assets to operate efficiently.
Loans Risk: The market for loans, including bank loans, loan participations, and syndicated loan assignments may not be highly liquid, and the holder may have difficulty selling them. These investments expose the Fund to the credit risk of both the financial institution and the underlying borrower. Bank loans settle on a delayed basis, which can be greater than seven days, potentially leading to the sale proceeds of such loans not being available for a substantial period of time after the sale of the bank loans.
Management Risk: The Adviser’s reliance on its proprietary trend-following model and the Adviser’s judgments about the attractiveness, value, and potential appreciation of particular assets may prove to be incorrect and may not produce the desired results.
Market Risk: Overall investment market risks affect the value of the Fund. Factors such as economic growth and market conditions, interest rate levels, and political events affect U.S. and international investment markets. Additionally, unexpected local, regional or global events, such as war; acts of terrorism; financial, political or social disruptions; natural, environmental or man-made disasters; the spread of infectious illnesses or other public health issues (such as the global pandemic coronavirus disease 2020 (COVID-19)); and recessions and depressions could have a significant impact on the Fund and its investments and may impair market liquidity. Such events can cause investor fear, which can adversely affect the economies of nations, regions and the market in general, in ways that cannot necessarily be foreseen.
Models and Data Risk: The Fund’s investment exposure is heavily dependent on proprietary quantitative models as well as information and data supplied by third parties (“Models and Data”). When Models and Data prove to be incorrect or incomplete, any decisions made in reliance thereon may lead to securities being included in or excluded from the Fund’s portfolio that would have been excluded or included had the Models and Data been correct and complete. Some of the models used by the Fund are predictive in nature. The use of predictive models has inherent risks. For example, such models may incorrectly forecast future behavior, leading to potential losses. In addition, in unforeseen or certain low-probability scenarios (often involving a market disruption of some kind), such models may produce unexpected results, which can result in losses for the Fund.
Non-Diversification Risk: As a non-diversified fund, the Fund may invest more than 5% of its total assets in the securities of one or more issuers. The Fund also invests in underlying funds that are non-diversified. The Fund’s performance may be more sensitive to any single economic, business, political or regulatory occurrence than the value of shares of a diversified investment company.
Small and Mid-Capitalization Companies Risk: Investing in or having exposure to the securities of small-capitalization and mid-capitalization companies involves greater risks and the possibility of greater price volatility than investing in larger capitalization and more-established companies. Investments in mid-cap companies involve less risk than investing in smallcap companies. Smaller companies may have limited operating history, product lines, and financial resources, and the securities of these companies may lack sufficient market liquidity. Mid-cap companies often have narrower markets and more limited managerial and financial resources than larger, more established companies.
Turnover Risk: A higher portfolio turnover may result in higher transactional and brokerage costs. The Fund’s portfolio turnover rate may be significantly above 100% annually
Underlying Funds Risk: Investments in underlying funds involve duplication of investment advisory fees and certain other expenses. Each underlying fund is subject to specific risks, depending on the nature of its investment strategy. The manager of an underlying fund may not be successful in implementing its strategy. ETF shares may trade at a market price that may be lower (a discount) or higher (a premium) than the ETF’s net asset value. ETFs are also subject to brokerage and/or other trading costs, which could result in greater expenses to the Fund. Because the value of ETF shares depends on the demand in the market, the Adviser may not be able to liquidate the Fund’s holdings at the most optimal time, adversely affecting performance.
U.S. Government Securities Risk: The Fund may invest directly or indirectly in obligations issued by agencies and instrumentalities of the U.S. government. The U.S. government may choose not to provide financial support to U.S. government sponsored agencies or instrumentalities if it is not legally obligated to do so, in which case, if the issuer defaulted, the Fund might not be able to recover its investment.
Advisory services offered through Kensington Asset Management, LLC.