


by Craig Love, on August 11, 2023
Kensington Market Insights - August 10th
Market Insights is a weekly piece in which Kensington’s Portfolio Management team will share interesting and thought-provoking charts that we believe provide insight into markets and the current investment landscape.
Seasons Change
Two weeks ago we outlined the case for a continued bull market in equities after a blistering start to the year. While this week's pullback may simply be a case of the market needing a breather after such a strong start, there are other indicators that point to potential short-term weakness as well.One of the most widely observed phenomena is that of market seasonality. Market seasonality refers to the tendency of financial markets to exhibit consistent patterns over the calendar year. While these patterns do not take into consideration the fundamental realities of the current market or economy, they can, at the very least, play a psychological role in investors' psyche and actions.
Sell in May…
The most widely recognized market seasonality saying is “Sell in May and go away,” also known as the “Halloween indicator,” which theorizes that markets underperform between May and October. And while the actual performance of the S&P 500 by month (below) does not back that up, with July actually being the strongest performing month, September has historically been a particularly bad month for the index. It has registered as the worst-performing month dating back to 1928, with an average monthly return of -1.1%, a full 1% worse than the next closest months (February and May).
Market Breadth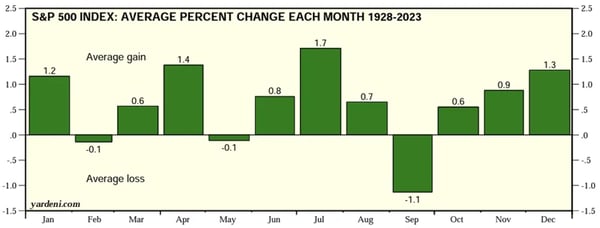
*No change (0.00%) month of September 1979. Data are through the end of July 2023.
Source: Standard & Poor's and Haver Analytics
Election Cycles
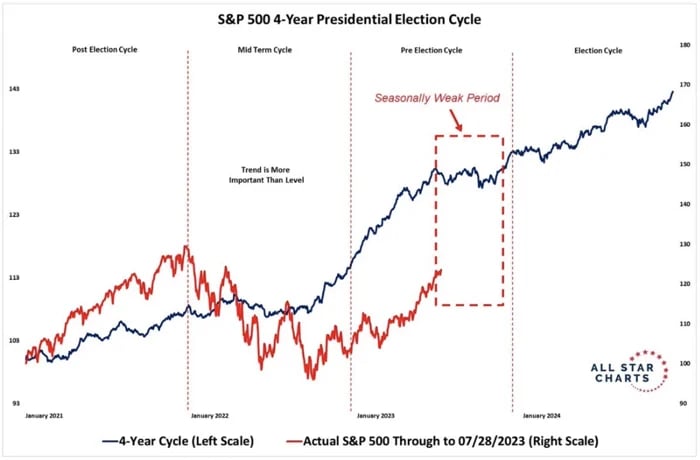
Investors often reference election cycle patterns in markets as well, with certain periods within the cycle historically outperforming others. As can be seen from the chart below, Pre-Election cycles (Year 3), in which we are currently situated, have shown historical strength. However, we've just entered a period (indicated by the red dotted box) in which the S&P 500 has historically stalled out heading into Election Year strength (Year 4).
Fund Flows
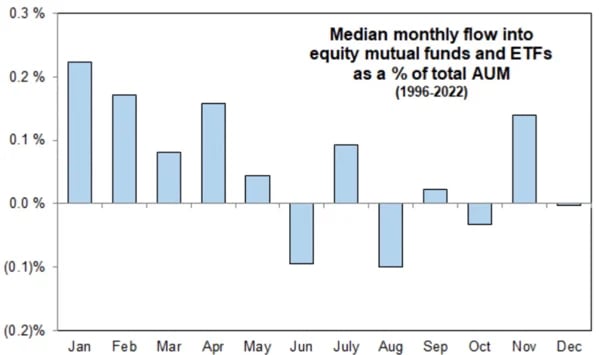
While August has historically shown fairly strong performance for the S&P 500 (averaging a 0.7% increase), it is the month that has experienced the most outflows from equity mutual funds and ETF’s dating back to 1996 (as shown below). This can be significant because market outflows can exert negative pricing pressure on a market. In fact, during weeks with net equity fund outflows, the S&P 500 has averaged a -0.12% weekly loss and only registered positive gains in 53% of outflow weeks, compared to 72% during net inflow weeks, according to Janus Henderson.
Convergence/Divergence
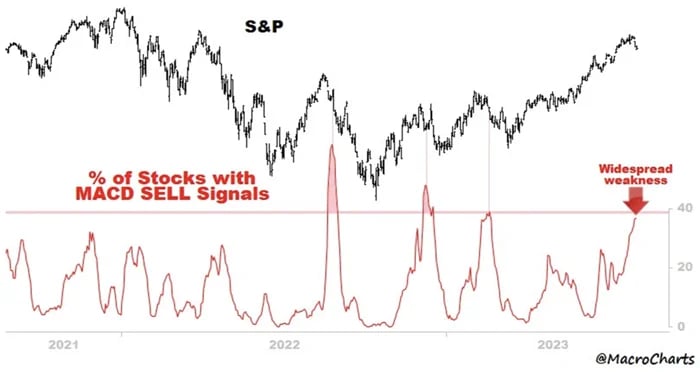
It's not just seasonality that presents evidence of potential short-term headwinds for equities. The MACD (Moving Average Convergence/Divergence) Indicator, is a momentum indicator relationship between two exponential moving averages (EMAs) of a security’s price. Looking at the S&P 500 you can see from the chart below that the number of securities in the S&P 500 showing a MACD sell signal has reached levels that have signaled a pullback in recent years.
Cash is King
There is also the matter of opportunity cost. With the historical rise in T-Bill yields, we’ve now reached a point where the yield on T-Bills is higher than the earnings yield for US stocks (below). This is the first time we’ve seen this occur in more than two decades, which may play a role in fund flows as investors evaluate the attractiveness of equities compared to the safety and opportunity in cash equivalents.
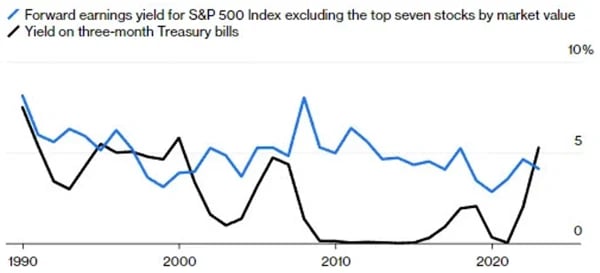
Source: Bloomberg
Note: Forward earnings yield is the inverse of the P/E ratio based on earnings estimates for companies' fiscal year.
None of this is to say that the bull market run is over. The points outlined two weeks ago are still pertinent, but it’s a good reminder that progress (and investment returns) don’t always progress in a straight line. Even during strong runs, there will be periods of weakness that must be navigated. Avoiding drawdowns is an important part of wealth preservation and wealth creation. Incorporating strategies that seek to identify and avoid market weakness (both short and long-term), can be beneficial to investors' portfolios.
Forward-looking statements are based on management’s then current views and assumptions and, as a result, are subject to certain risks and uncertainties that could cause actual results to differ materially from those projected. This market insight is for informational purposes only and should not be construed as a solicitation to buy or sell, or to invest in any investment product or strategy. Investing involves risk including loss of principal.