


by Craig Love, on October 25, 2023
Kensington Monthly Market Commentary: September 2023
Geopolitics: Geopolitical risk has moved to the forefront with the surprise attack by Hamas on the state of Israel. The incursion now forces the West to expend resources on two wars, stretching military capabilities and defense supply chains. While war has historically not been deleterious to financial markets, the uncertainty around possible expansion is a decided concern. More importantly for investors, price volatility in energy markets becomes an obvious risk, affecting overall input costs and inflationary pressures.
It won’t come as a surprise to learn Russia and Iran are directly involved in the current Middle East conflagration, as it serves two main goals for them: 1) it weakens the ability of the U.S. to prosecute the war in Ukraine (to what degree is unknown); 2) it throws into disarray Saudi Arabia’s plans to formally recognize Israel and establish itself as the major political actor in the region while serving to isolate Iran, its chief antagonist. The conflict also increases political dissonance within the West, at a time when far right and left populism is already on the rise and centrist policies under attack.
In the meantime, China continues to take measures to stimulate its economy, with reports it may approve greater deficit spending, above the 3% cap set in March. This follows on top of the People’s Bank of China cutting banks’ reserve ratio requirements and funding costs and the government cutting interest rates and downpayment ratios for mortgages. With regards to the latter, authorities hope the additional support will prop up the critical property sector leading to an improvement in consumer sentiment and spending.
Stock market: September was a difficult month for equities with all major domestic indices declining significantly. For the month, the S&P 500 Index1 fell -4.87%, the tech-centric Nasdaq 100 Index2 lost -5.07% and the small-cap Russell 2000 Index3 brought up the rear, down -6.03%. It was not difficult spotting the culprit, as interest rates rose to multi-year highs on the back of surprisingly strong economic data and headline inflation numbers that, while improved, still aren’t low enough to give the Fed sufficient reason to reverse its tightening bias.
Higher interest rates also pose a threat to the longer-term prospect for stocks. As we can see in the chart below, the required premium for equities globally has shrunk considerably over the past couple of years as rates have risen:
Equity Risk Premium Across Regions
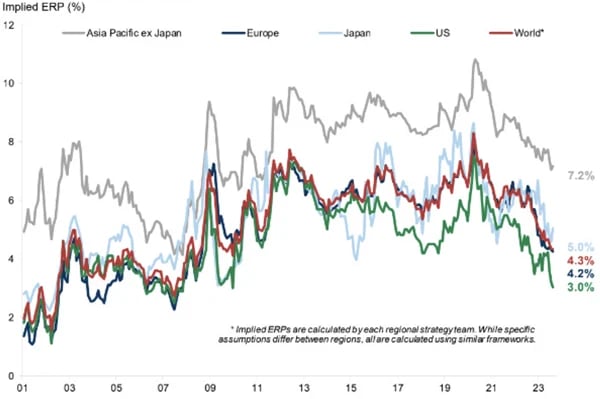
This reduction in risk premia is entirely a function of higher interest rates as company earnings have been robust and credit spreads benign. Historically, equities struggle when risk premiums are low as the relative attraction of bonds and cash increases. If rates continue to remain higher than expected, the bull case will rest in the main on corporate earnings growth. That may well be in the cards, argues strategist and economist Ed Yardeni, who forecasts “much better than widely expected” Q3 earnings with S&P 500 operating earnings per share hitting new highs in 2023.
Fixed Income: Fixed income markets suffered meaningful losses in September, with the broad U.S. Aggregate Bond Index4 declining -2.54%. The Corporate Investment Grade Index5 was down -2.67%, Bloomberg US Mortgage Backed Securities (MBS) Index fell -3.19% and even high yield bonds, as measured by the Bloomberg US Corporate High Yield Index, which have been somewhat immune to rising rates given their positive correlation to equities and economic growth, saw their first monthly decline in several months, falling -1.18%. The largest losses were seen in longer term Treasuries with the 10-year falling -3.44% and the 30-year -7.58%. The immense size (~$2Trillion) of Treasury issuance was a factor in depressing prices as the market was flooded with supply.
The losses in the Treasury market since the pandemic highs have been monumental. In a widely quoted piece, Bank of America’s chief investment strategist, Michael Hartnett, pointed out the past three years have amounted to the worst bear market in Treasury debt in the nearly 250-year history of the U.S. with some issues losing as much as half their value (see the two charts below).
The Greatest Treasury Bear Market of All Time . . . 2020 - Today
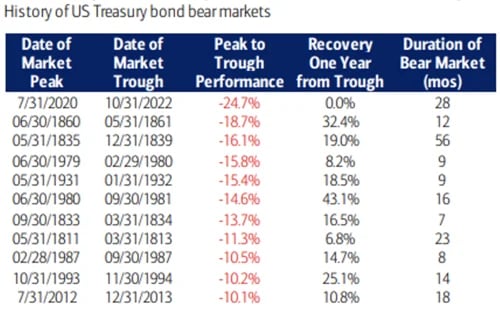
Source: BofA Global Investment Strategy, Global Financial Data; "bond bear market" = total return decline of 10% or more
Never in the History of the US Republic Have US Treasury Returns Fallen 3 Years in a Row
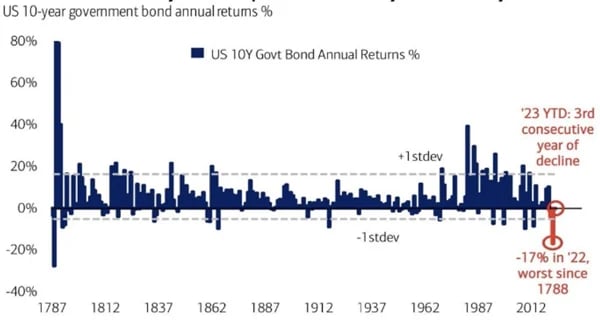
Source: BofA Global Investment Strategy, Bloomberg, Global Financial Data
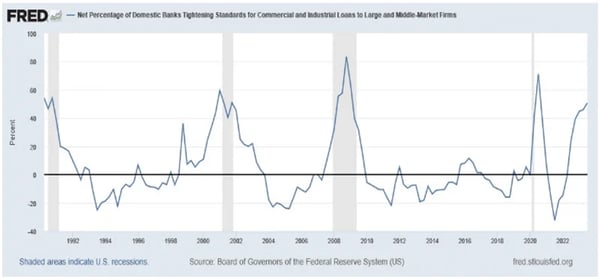
Given such deep losses, it’s not unreasonable to assume that one or more presumably leveraged investors in these securities may be faced with the threat of insolvency. One logical place to look is the banks who piled into longer duration Treasuries at much lower yields and are now faced with substantial mark to market losses. But while the threat of insolvency may be problematic, perhaps the more important point is whether the negative impact on these institutions’ equity is such that it greatly affects their ability to lend. Already banks have raised their lending standards (see chart below) to a level that in the past has coincided with the onset of recession.
The Federal Reserve and Monetary Policy: Fed policy appears to be caught between a rock and a hard place, faced with the possibility of a severe dislocation in rate markets due to their continued tightening, while simultaneously contending with an economy that refuses to decelerate in any meaningful way. To be clear, there are many warning signs a recession is ahead, but the slowdown’s arrival continues to be delayed by the huge fiscal stimulus emanating out of Washington. And given 2024 is an election year, it’s difficult to envision such spending will be curtailed in any meaningful way.
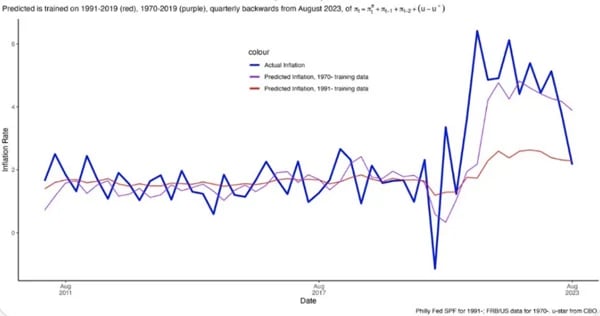
Still, there are reasons to be optimistic the Fed’s tightening regime is set to end with a protracted period of stable, if not lower, rates ahead. As Mike Konczal, director of Macroeconomic Analysis at the Roosevelt Institute, recently wrote: “Core PCE has a monthly value below 2 percent annualized (the Fed's target) for the first time since the lockdowns. But under the hood it's even better - it's all in the right directions. Let's dive in. This month [August] had zero inflation in core goods and further slowing in services, especially non-housing services. This is exactly the scenario we want to see…. What is the Fed seeing? Well here's their favored Phillips Curve specification, trained on data from 1970- (stagflation model) and 1991- (Great Moderation model). Folks, we're back. It's right on the moderation line….”
Actual vs. Predicted PCE Core Inflation on Federal Reserve's Phillips Curve Specification
And while labor markets have been stronger than forecast, the latest average hourly earnings print showed a Year over Year (“YoY”) increase of only 2.4%, lower than the Fed’s wage growth target. The closely watched unemployment claims report continues to come in beneath expectations, but if history is a guide, it begins to turn up about a year or so after a yield curve inversion, meaning right about now.
Evolution of Initial Unemployment Claims After Yield Curve Inversion
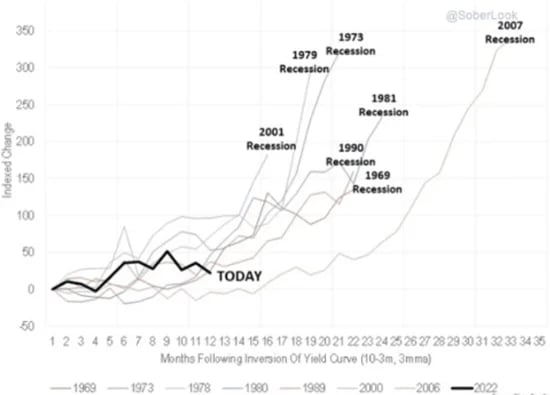
If unemployment claims exceed their 12 month moving average in a meaningful way, odds are very high the economy has moved into recession. It will take only a very small jump in the number to occur, so this number bears watching. The other tell tale indicator is the 2-year Treasury. Unlike its longer duration brethren, the 2-year rate has essentially been flatlining since early June. A pronounced downturn here will all but confirm a recession is on its way.
Managed Income Strategy
After a relatively stable August, the Bloomberg US Corporate High Yield Index experienced the beginning of a downtrend in the month of September. As yields pushed higher, most areas of the bond markets experienced declines during the month. For most of the month, the Managed Income portfolio remained tilted heavily to US High Yield, with a meaningful portion in floating rate fixed income. As in recent months, the floating rate sector delivered a positive return for the month, having outperformed many sectors of the bond market. Toward month end, due to deteriorating trends in US High Yield as well as equity market breadth, Managed Income moved into a Risk-Off position allocated to cash equivalents.
Dynamic Growth Strategy
Dynamic Growth spent the month of September alternating between Risk-On and Risk-Off postures, as equity markets fell from a peak made at the end of August. As we have previously noted, September is historically a higher volatility month for the stock market, and this year was no exception. As a result, all major indices reported negative returns for the month. Due to the time spent in a Risk-Off posture in cash equivalents, Dynamic Growth was able to mitigate volatility and drawdown during the period. Toward the end of the month, Dynamic Growth migrated back to a Risk-On signal, rotating back into equities.
Active Advantage Strategy
The Active Advantage strategy spent the month of September in a balanced portfolio, with approximately 60% in equities and 40% in fixed income. Toward the end of the month, as broader market trends deteriorated, Active Advantage moved to an allocation of 20% in growth equities and 80% in cash equivalents. We would anticipate Active Advantage will remain broadly in cash until volatility abates and positive trends are restored in fixed income.
Defender Strategy
The Defender Strategy measured further decreased momentum across several tracked asset classes entering the month of October with only five categories exhibiting a positive score. This change along with caution across all fundamental categories caused a shift to a Risk-Off posture for the period. The option overlay strategy in the fund remains in position for the month of October. September proved to be a challenging month for the financial markets. Stocks across the board finished lower as there was really no place to hide. After peaking on July 31st, the S&P 500 and Russell 2000 lost ground quickly, falling -6.3% and -10.8%, respectively, through the remainder of the quarter. Meanwhile, intermediate to longer term bonds also struggled, with the Aggregate Bond Index6 down roughly -3% during the quarter. With the S&P 500 up roughly 13% year-to-date, today’s market action is causing many to scratch their head as the results they see in their portfolios don’t seem to line up with what they are seeing in the financial news media. It is important to be able to contextualize what is really happening behind the scenes with the underlying market conditions, which are not as rosy as they seem on the surface. Given this environment, The Kensington Defender Fund continues to remain cautious leading into Q4.
1 The S&P 500 is a stock market index that measures the performance of about 500 companies in the United States.
2 The Nasdaq 100 is a stock market index made up of 101 equity securities issued by 100 of the largest non-financial companies listed on the Nasdaq stock exchange.
3 The Russell 2000 Index is a small-cap U.S. stock market index that makes up the smallest 2,000 stocks in the Russell 3000 Index.
4 The Bloomberg US Aggregate Bond Index, also known as “the Agg,” is a broad-based bond market index representing intermediate term investment grade bonds traded in the United States.
5 The Corporate Investment Grade Index is a type of bond index that tracks the performance of debt securities with a relatively low risk of default, as rated by credit rating agencies.
6 The Bloomberg US Aggregate Bond Index, also known as “the Agg,” is a broad-based bond market index representing intermediate term investment grade bonds traded in the United States.
Investing involves risk. Principal loss is possible.
Risks specific to the Managed Income Strategy include Management Risk, High-Yield Risk, Fixed-Income Security Risk, Foreign Investment Risk, Loans Risk, Market Risk, Underlying Funds Risk, Non-Diversification Risk, Turnover Risk, U.S. Government Securities Risk, Interest Rate Risk, Models and Data Risk.
Risks specific to the Dynamic Growth Strategy include Management Risk, Equity Securities Risk, Market Risk, Underlying Funds Risk, Non-Diversification Risk, Small and Mid-Capitalization Companies Risk, Turnover Risk, U.S. Government Securities Risk, Models and Data Risk.
Risks specific to the Active Advantage Strategy include Management Risk, Equity Securities Risk, High-Yield Risk, Fixed- Income Security Risk, Foreign Investment Risk, Loans Risk, Market Risk, Underlying Funds Risk, Limited History of Operations Risk, Non-Diversification Risk, Small and Mid-Capitalization Companies Risk, Turnover Risk, U.S. Government Securities Risk, Interest Rate Risk, Models and Data Risk.
There is no guarantee that the investment objectives will be achieved. Moreover, the past performance is not a guarantee or indicator of future results. The investment return and principal value of an investment will fluctuate so that an investor’s shares, when redeemed, may be worth more or less than their original cost.
This is for informational purposes only and should not be construed as a solicitation to buy or sell, or to invest in any investment product or strategy. Investing in securities markets involves risk and the degree of risk varies by the type of investment or strategy. For a complete list of the risks associated with each of our Strategies, please review the Strategy Brochure and Factsheet. Materials such as blog posts, newsletters or commentary may contain information deemed to be correct and appropriate at a given time but may not reflect our current views or opinions due to changing market conditions. No information provided should be viewed as, or used as a substitute for individualized investment advice.
This document does not constitute advice or a recommendation or offer to sell or a solicitation to deal in any security or financial product. It is provided for information purposes only and on the understanding that the recipient has sufficient knowledge and experience to be able to understand and make their own evaluation of the proposals and services described herein, any risks associated therewith and any related legal, tax, accounting or other material considerations. To the extent that the reader has any questions regarding the applicability of any specific issue discussed above to their specific portfolio or situation, prospective investors are encouraged to contact the professional advisor of their choosing.
Certain information contained herein has been obtained from third party sources and such information has not been independently verified by Kensington Asset Management, LLC (“KAM”). No representation, warranty, or undertaking, expressed or implied, is given to the accuracy or completeness of such information by KAM or any other person. While such sources are believed to be reliable, KAM does not assume any responsibility for the accuracy or completeness of such information. KAM does not undertake any obligation to update the information contained herein as of any future date.
Any indices and other financial benchmarks shown are provided for illustrative purposes only, are unmanaged, reflect reinvestment of income and dividends and do not reflect the impact of advisory fees. Investors cannot invest directly in an index. Comparisons to indexes have limitations because indexes have volatility and other material characteristics that may differ from a particular strategy. For example, a strategy may typically hold substantially fewer securities than are contained in an index.
Certain information contained herein constitutes “forward-looking statements,” which can be identified by the use of forward-looking terminology such as “may,” “will,” “should,” “expect,” “anticipate,” “project,” “estimate,” “intend,” “continue,” or “believe,” or the negatives thereof or other variations thereon or comparable terminology. Due to various risks and uncertainties, actual events, results or actual performance may differ materially from those reflected or contemplated in such forward-looking statements. Nothing contained herein may be relied upon as a guarantee, promise, assurance or a representation as to the future.
Definitions:
Equity Securities Risk: The Fund may invest in or have exposure to equity securities. Equity securities may experience sudden, unpredictable drops in value or long periods of decline in value. This may occur because of factors that affect securities markets generally or factors affecting specific industries, sectors, geographic markets, or companies in which the Fund invests.
Fixed-Income Security Risk: The Fund may invest in or have exposure to fixed-income securities. Fixed-income securities are or may be subject to interest rate, credit, liquidity, prepayment and extension risks. Interest rates may go up resulting in a decrease in the value of fixed-income securities. Credit risk is the risk that an issuer will not make timely payments of principal and interest. There is also the risk that an issuer may “call,” or repay, its high yielding bonds before their maturity dates. Fixed-income securities subject to prepayment can offer less potential for gains during a declining interest rate environment and similar or greater potential for loss in a rising interest rate environment. Limited trading opportunities for certain fixed-income securities may make it more difficult to sell or buy a security at a favorable price or time. Changes in market conditions and government policies may lead to periods of heightened volatility and reduced liquidity in the fixed income securities market, and could result in an increase in redemptions. Interest rate changes and their impact on a fund and its share price can be sudden and unpredictable.
Foreign Investment Risk: Foreign investments may be riskier than U.S. investments for many reasons, such as changes in currency exchange rates and unstable political, social, and economic conditions.
High-Yield Risk: Lower-quality fixed income securities, known as “high-yield” or “junk” bonds, present greater risk than bonds of higher quality, including an increased risk of default. These securities are considered speculative. Defaulted securities or those subject to a reorganization proceeding may become worthless and are illiquid.
LIBOR Risk: Changes related to the use of the London Interbank Offered Rate (LIBOR) or similar interbank offered rates (“IBORs,” such as the Euro Overnight Index Average (EONIA)) could have adverse impacts on financial instruments that reference LIBOR or a similar rate. While some instruments may contemplate a scenario where LIBOR or a similar rate is no longer available by providing for an alternative rate setting methodology, not all instruments have such fallback provisions and the effectiveness of replacement rates is uncertain. The abandonment of LIBOR and similar rates could affect the value and liquidity of instruments that reference such rates, especially those that do not have fallback provisions. The use of alternative reference rate products may impact investment strategy performance.
Limited History of Operations Risk: The Fund has a limited history of operations for investors to evaluate. The Fund may fail to attract sufficient assets to operate efficiently.
Loans Risk: The market for loans, including bank loans, loan participations, and syndicated loan assignments may not be highly liquid, and the holder may have difficulty selling them. These investments expose the Fund to the credit risk of both the financial institution and the underlying borrower. Bank loans settle on a delayed basis, which can be greater than seven days, potentially leading to the sale proceeds of such loans not being available for a substantial period of time after the sale of the bank loans.
Management Risk: The Adviser’s reliance on its proprietary trend-following model and the Adviser’s judgments about the attractiveness, value, and potential appreciation of particular assets may prove to be incorrect and may not produce the desired results.
Market Risk: Overall investment market risks affect the value of the Fund. Factors such as economic growth and market conditions, interest rate levels, and political events affect U.S. and international investment markets. Additionally, unexpected local, regional or global events, such as war; acts of terrorism; financial, political or social disruptions; natural, environmental or man-made disasters; the spread of infectious illnesses or other public health issues (such as the global pandemic coronavirus disease 2020 (COVID-19)); and recessions and depressions could have a significant impact on the Fund and its investments and may impair market liquidity. Such events can cause investor fear, which can adversely affect the economies of nations, regions and the market in general, in ways that cannot necessarily be foreseen.
Models and Data Risk: The Fund’s investment exposure is heavily dependent on proprietary quantitative models as well as information and data supplied by third parties (“Models and Data”). When Models and Data prove to be incorrect or incomplete, any decisions made in reliance thereon may lead to securities being included in or excluded from the Fund’s portfolio that would have been excluded or included had the Models and Data been correct and complete. Some of the models used by the Fund are predictive in nature. The use of predictive models has inherent risks. For example, such models may incorrectly forecast future behavior, leading to potential losses. In addition, in unforeseen or certain low-probability scenarios (often involving a market disruption of some kind), such models may produce unexpected results, which can result in losses for the Fund.
Non-Diversification Risk: As a non-diversified fund, the Fund may invest more than 5% of its total assets in the securities of one or more issuers. The Fund also invests in underlying funds that are non-diversified. The Fund’s performance may be more sensitive to any single economic, business, political or regulatory occurrence than the value of shares of a diversified investment company.
Small and Mid-Capitalization Companies Risk: Investing in or having exposure to the securities of small-capitalization and mid-capitalization companies involves greater risks and the possibility of greater price volatility than investing in larger capitalization and more-established companies. Investments in mid-cap companies involve less risk than investing in smallcap companies. Smaller companies may have limited operating history, product lines, and financial resources, and the securities of these companies may lack sufficient market liquidity. Mid-cap companies often have narrower markets and more limited managerial and financial resources than larger, more established companies.
Turnover Risk: A higher portfolio turnover may result in higher transactional and brokerage costs. The Fund’s portfolio turnover rate may be significantly above 100% annually
Underlying Funds Risk: Investments in underlying funds involve duplication of investment advisory fees and certain other expenses. Each underlying fund is subject to specific risks, depending on the nature of its investment strategy. The manager of an underlying fund may not be successful in implementing its strategy. ETF shares may trade at a market price that may be lower (a discount) or higher (a premium) than the ETF’s net asset value. ETFs are also subject to brokerage and/or other trading costs, which could result in greater expenses to the Fund. Because the value of ETF shares depends on the demand in the market, the Adviser may not be able to liquidate the Fund’s holdings at the most optimal time, adversely affecting performance.
U.S. Government Securities Risk: The Fund may invest directly or indirectly in obligations issued by agencies and instrumentalities of the U.S. government. The U.S. government may choose not to provide financial support to U.S. government sponsored agencies or instrumentalities if it is not legally obligated to do so, in which case, if the issuer defaulted, the Fund might not be able to recover its investment.
Advisory services offered through Kensington Asset Management, LLC.