


by Craig Love, on November 27, 2023
Kensington Monthly Market Commentary: October 2023
Geopolitics: With ongoing wars in both the Middle East and Ukraine, the long-term risk to markets lies in the potential expansion of these military engagements and the additional pressure these engagements could exert on affected commodity prices, particularly oil. The total impact will take time to become clear and will undoubtedly depend on how long these conflicts last, how intense they become, and whether they spread to other parts of the region. While the onset of fighting between Israel and Hamas did initially result in a spike in commodity markets, with Brent crude oil and European natural gas prices up by around 9% and 34% at the peak respectively, prices have since subsided with the Brent crude oil price almost back at pre-conflict levels by the end of October.
Further escalation could meaningfully impact global growth and inflation, as the region is a crucial supplier of energy and a key global shipping passageway, but the impact of prior escalations in the region have had varied impact historically. For now, at least in the US, the effect of inflation has seemingly been minimal, with the October Consumer Price Index (“CPI”) coming in far better than expected with headline inflation cooling from 3.7% to 3.2%.
Stock market: October marked the third month in a row equities declined with the S&P 5001 falling -2.20%, the Nasdaq 1002 down -2.08% and the small cap Russell 20003 incurring a much larger decline of -6.88%.
The poor relative performance by the Russell 2000 is emblematic of the bifurcated nature of the market this year, with AI/megatech stocks performing very well while the rest of the market struggles. This isn’t surprising given the booming demand for technology hardware and software and generative artificial intelligence’s long-term potential. At the same time, higher interest rates are benefiting these cash rich companies, whereas smaller firms are burdened by record interest expense, as illustrated by the chart below:
Smaller Companies are Paying Record Interest Expense,
Without a Major Boost from Interest Income
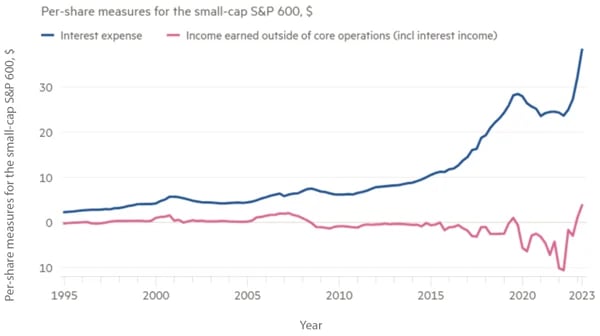 Source: Ned Davis Research, S&P Capital IQ
On the other hand, this outperformance by a very small subset of stocks cannot go on forever as eventually their positive outlook will be fully priced, if it hasn’t been already. According to investment strategist Rich Bernstein, the Magnificent Seven, a group comprising seven stocks that collectively contribute to approximately half of the NASDAQ's weighting, are trading at an average price-to-earnings ratio (“P/E”) of 41, compared with the equal-weighted S&P 500’s P/E of 15. If Bernstein is right about corporate profits accelerating and assuming the overall economy remains healthy, a broadening in stock market leadership may be at hand, leading to further market advances.
Forward Earnings Expectations March Higher
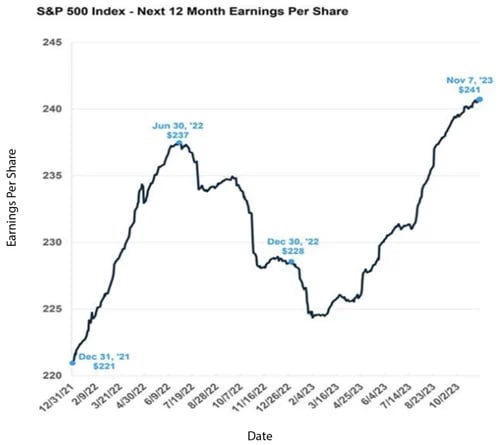
Source: Carson Investment Research, Factset 11/08/2023
Also arguing for a change in leadership is the performance spread between the S&P 500 (cap-weighted) and the S&P 500 equal weighted. By late October, the spread between the two was the most extreme in favor of the cap-weighted index through 205 trading days, i.e., year to date, since at least 1990.
S&P 500 vs. S&P 500 Equal Weight: YTD %Chg 2023
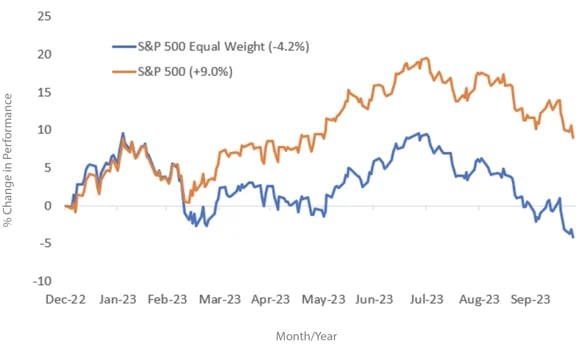
Source: Bespoke Investment Group
Fixed Income: Fixed income markets again suffered losses in October, with the 10-year Treasury declining -2.26%, the broad U.S. Aggregate Bond Index4 losing -1.58%, The U.S. Corporate Investment Grade Index5 down -1.87%, the S&P 500 U.S. Mortgage backed Securities Index6 falling -2.07% and even the S&P 500 U.S. High Yield Corporate Bond Index7 – the bond market stalwart this year – retreating -1.16%.
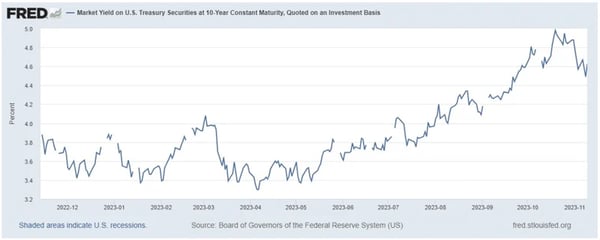
The very large Treasury issuance in Q4 2023 stoked concerns over the severity of a supply demand imbalance, one that could force rates higher in order to allow markets to clear. This combined with hotter than expected economic reports over the course of the month – factory orders jumped 1.2% - much higher than consensus forecasts - a blowout non-farm payrolls print, strong retail sales and unemployment claims continuing to baseline at recent lows – prompted investors to sell duration and opt for the safety of short-term cash. Both the 10- and 30-year Treasury rates rose to levels in the month not seen since 2007.
US 10-Year Yield Hits 5%
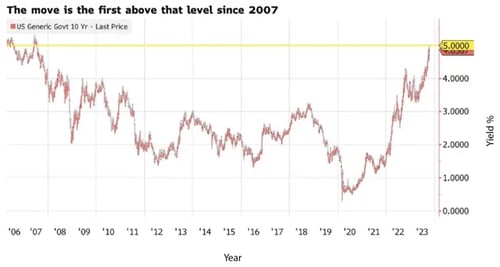
Source: Bloomberg
Fears were allayed, however, when the Treasury unexpectedly changed its mix of short and long term debt issuance, emphasizing Treasury bills at a time when investors prefer shorter term maturities. The bond market reacted positively, with rates falling precipitously the first week of November.
With the Federal Reserve holding rates steady at their November 1st Federal Open Market Committee (“FOMC”) meeting, and with the now perceived expectation that the rate hiking cycle has concluded, some short-term relief in fixed income may lie ahead. Yields have meaningfully compressed post month end with the 10-year Treasury yield falling below 4.5% for the first time since late September and meaningfully down from a high of 4.98% on October 19th.
The Federal Reserve and Economic Policy: As previously noted, post month-end, at the November FOMC meeting, the Federal Reserve ("Fed") held the benchmark rate steady for the second meeting in a row, creating market optimism that the Fed may be done with its hiking cycle. The Fed’s decision, coupled with the stronger than expected October CPI report, has significantly shifted expectations for future Fed action for the remainder of 2023 and 2024. As of November 14th, futures markets were pricing in a near 0% chance of additional rate hikes going forward with rate cuts now expected to begin in May 2024. Prior to the CPI report, there was a 30% chance of at least one more rate hike ahead and rate cuts were not expected to begin until June 2024. Now markets are pricing in at least 4 rate cuts in 2024, a significant and potentially bullish sign for the asset class.
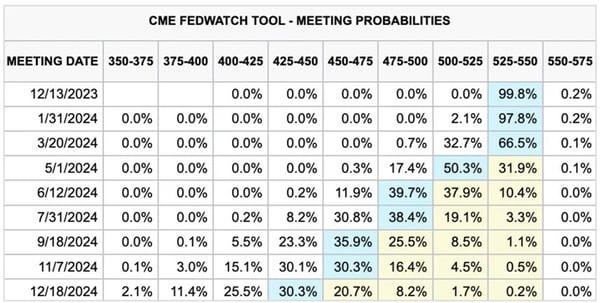
Source: CME Group
Managed Income Strategy
Toward the end of September, Managed Income moved back to a “Risk-Off” position, as trends in US High Yield, along with general market breadth, showed signs of weakness. The portfolio was positioned into cash equivalents. During October, the high yield sector remained tepid, leaving the sector with negative returns for the month. In “Risk -Off” mode, Managed Income was able to avoid this drawdown, while collecting yield from its cash equivalents position. Going into November, the seasonal pattern for the markets becomes more favorable. After Federal Reserve Jerome Powell’s comments sparked a broad market rally in early November, the Managed Income model produced a “Risk-On” signal. US high yield corporate bonds have begun to trend positively, as market participants believe the Federal Reserve has no additional rate hikes planned this calendar year. The newly established up trend, combined with lowered volatility and broadening equity strength, have resulted in this signal change.
Dynamic Growth Strategy
Dynamic Growth spent the front half of the month of October in a “Risk-On” stance before retreating to cash equivalents toward month end. Due to this move to cash equivalents, Dynamic Growth was able to guard against a portion of the equity market drawdowns for the month. Toward month end, Dynamic Growth re-entered a “Risk-On” posture, driven by lowering volatility and broadening trends in the equity market. Despite reasons for optimism about the upside potential of the current advance, Dynamic Growth remains vigilant, and we anticipate the model will move back to a “Risk-Off” posture in a timely manner if current conditions deteriorate.
Active Advantage Strategy
Active Advantage spent the month of October primarily in cash equivalents, with a small allocation to growth equities. As with Managed Income and Dynamic Growth, Active Advantage entered a full “Risk-On” positioning early in the month of November. This positioning is balanced, with approximately 60% across equities (both growth and core) and 40% in fixed income, including US high yield and investment grade corporates.
Defender Strategy
The Defender Strategy had the same depressed momentum across the tracked asset classes entering the month of October, further reducing risk exposure to Risk-Off. This move was prudent given the overall equity and fixed income markets experienced negative results, with stocks falling for the 3rd consecutive month after a strong start to the year. Since the end of July, US Large Caps (the S&P 500) and Small Caps (the Russell 2000) were down approximately 8% and 17%, respectively. International equities also were negative for the month and quarter. Longer-term interest rates (10 yr to 30 yr) continued their upward trajectory, since early July, fueled by stronger than expected economic growth and re-accelerating inflation. For continued diversified income generation potential, the Strategy’s Option Overlay positions remain in place.
1 The S&P 500 is a stock market index that tracks the stock performance of about 500 of the largest U.S. public companies.
2 The Nasdaq 100 is a stock market index made up of 101 equity securities issued by 100 of the largest non-financial companies listed on the Nasdaq stock exchange.
3 The Russell 2000 is a stock index that tracks the performance of 2,000 small-capitalization companies.
4 The U.S. Aggregate Bond Index, also known as the Agg, is a benchmark that measures the performance of the investment-grade, U.S. dollar-denominated, fixed-rate taxable bond market.
5 The U.S. Corporate Investment Grade Index is a benchmark that measures the performance of U.S. corporate debt issued by constituents in the S&P 500 with an investment-grade rating.
6 The S&P U.S. Mortgage-Backed Securities Index is a rules-based market-value-weighted index covering U.S. dollar-denominated, fixed-rate and adjustable-rate/hybrid mortgage pass-through securities issued by Ginnie Mae (“GNMA”), Fannie Mae (“FNMA”) and Freddie Mac (“FHLMC”).
7 The S&P U.S. High Yield Corporate Bond Index is designed to track the performance of U.S. dollar-denominated, high-yield corporate bonds issued by companies whose country of risk use official G-10 currencies, excluding those countries that are members of the United Nations Eastern European Group (“EEG”).
Investing involves risk. Principal loss is possible.
Risks specific to the Managed Income Strategy include Management Risk, High-Yield Risk, Fixed-Income Security Risk, Foreign Investment Risk, Loans Risk, Market Risk, Underlying Funds Risk, Non-Diversification Risk, Turnover Risk, U.S. Government Securities Risk, Interest Rate Risk, Models and Data Risk.
Risks specific to the Dynamic Growth Strategy include Management Risk, Equity Securities Risk, Market Risk, Underlying Funds Risk, Non-Diversification Risk, Small and Mid-Capitalization Companies Risk, Turnover Risk, U.S. Government Securities Risk, Models and Data Risk.
Risks specific to the Active Advantage Strategy include Management Risk, Equity Securities Risk, High-Yield Risk, Fixed- Income Security Risk, Foreign Investment Risk, Loans Risk, Market Risk, Underlying Funds Risk, Limited History of Operations Risk, Non-Diversification Risk, Small and Mid-Capitalization Companies Risk, Turnover Risk, U.S. Government Securities Risk, Interest Rate Risk, Models and Data Risk.
There is no guarantee that the investment objectives will be achieved. Moreover, the past performance is not a guarantee or indicator of future results. The investment return and principal value of an investment will fluctuate so that an investor’s shares, when redeemed, may be worth more or less than their original cost.
This is for informational purposes only and should not be construed as a solicitation to buy or sell, or to invest in any investment product or strategy. Investing in securities markets involves risk and the degree of risk varies by the type of investment or strategy. For a complete list of the risks associated with each of our Strategies, please review the Strategy Brochure and Factsheet. Materials such as blog posts, newsletters or commentary may contain information deemed to be correct and appropriate at a given time but may not reflect our current views or opinions due to changing market conditions. No information provided should be viewed as, or used as a substitute for individualized investment advice.
This document does not constitute advice or a recommendation or offer to sell or a solicitation to deal in any security or financial product. It is provided for information purposes only and on the understanding that the recipient has sufficient knowledge and experience to be able to understand and make their own evaluation of the proposals and services described herein, any risks associated therewith and any related legal, tax, accounting or other material considerations. To the extent that the reader has any questions regarding the applicability of any specific issue discussed above to their specific portfolio or situation, prospective investors are encouraged to contact the professional advisor of their choosing.
Certain information contained herein has been obtained from third party sources and such information has not been independently verified by Kensington Asset Management, LLC (“KAM”). No representation, warranty, or undertaking, expressed or implied, is given to the accuracy or completeness of such information by KAM or any other person. While such sources are believed to be reliable, KAM does not assume any responsibility for the accuracy or completeness of such information. KAM does not undertake any obligation to update the information contained herein as of any future date.
Any indices and other financial benchmarks shown are provided for illustrative purposes only, are unmanaged, reflect reinvestment of income and dividends and do not reflect the impact of advisory fees. Investors cannot invest directly in an index. Comparisons to indexes have limitations because indexes have volatility and other material characteristics that may differ from a particular strategy. For example, a strategy may typically hold substantially fewer securities than are contained in an index.
Certain information contained herein constitutes “forward-looking statements,” which can be identified by the use of forward-looking terminology such as “may,” “will,” “should,” “expect,” “anticipate,” “project,” “estimate,” “intend,” “continue,” or “believe,” or the negatives thereof or other variations thereon or comparable terminology. Due to various risks and uncertainties, actual events, results or actual performance may differ materially from those reflected or contemplated in such forward-looking statements. Nothing contained herein may be relied upon as a guarantee, promise, assurance or a representation as to the future.
Definitions:
Equity Securities Risk: The Fund may invest in or have exposure to equity securities. Equity securities may experience sudden, unpredictable drops in value or long periods of decline in value. This may occur because of factors that affect securities markets generally or factors affecting specific industries, sectors, geographic markets, or companies in which the Fund invests.
Fixed-Income Security Risk: The Fund may invest in or have exposure to fixed-income securities. Fixed-income securities are or may be subject to interest rate, credit, liquidity, prepayment and extension risks. Interest rates may go up resulting in a decrease in the value of fixed-income securities. Credit risk is the risk that an issuer will not make timely payments of principal and interest. There is also the risk that an issuer may “call,” or repay, its high yielding bonds before their maturity dates. Fixed-income securities subject to prepayment can offer less potential for gains during a declining interest rate environment and similar or greater potential for loss in a rising interest rate environment. Limited trading opportunities for certain fixed-income securities may make it more difficult to sell or buy a security at a favorable price or time. Changes in market conditions and government policies may lead to periods of heightened volatility and reduced liquidity in the fixed income securities market, and could result in an increase in redemptions. Interest rate changes and their impact on a fund and its share price can be sudden and unpredictable.
Foreign Investment Risk: Foreign investments may be riskier than U.S. investments for many reasons, such as changes in currency exchange rates and unstable political, social, and economic conditions.
High-Yield Risk: Lower-quality fixed income securities, known as “high-yield” or “junk” bonds, present greater risk than bonds of higher quality, including an increased risk of default. These securities are considered speculative. Defaulted securities or those subject to a reorganization proceeding may become worthless and are illiquid.
LIBOR Risk: Changes related to the use of the London Interbank Offered Rate (LIBOR) or similar interbank offered rates (“IBORs,” such as the Euro Overnight Index Average (EONIA)) could have adverse impacts on financial instruments that reference LIBOR or a similar rate. While some instruments may contemplate a scenario where LIBOR or a similar rate is no longer available by providing for an alternative rate setting methodology, not all instruments have such fallback provisions and the effectiveness of replacement rates is uncertain. The abandonment of LIBOR and similar rates could affect the value and liquidity of instruments that reference such rates, especially those that do not have fallback provisions. The use of alternative reference rate products may impact investment strategy performance.
Limited History of Operations Risk: The Fund has a limited history of operations for investors to evaluate. The Fund may fail to attract sufficient assets to operate efficiently.
Loans Risk: The market for loans, including bank loans, loan participations, and syndicated loan assignments may not be highly liquid, and the holder may have difficulty selling them. These investments expose the Fund to the credit risk of both the financial institution and the underlying borrower. Bank loans settle on a delayed basis, which can be greater than seven days, potentially leading to the sale proceeds of such loans not being available for a substantial period of time after the sale of the bank loans.
Management Risk: The Adviser’s reliance on its proprietary trend-following model and the Adviser’s judgments about the attractiveness, value, and potential appreciation of particular assets may prove to be incorrect and may not produce the desired results.
Market Risk: Overall investment market risks affect the value of the Fund. Factors such as economic growth and market conditions, interest rate levels, and political events affect U.S. and international investment markets. Additionally, unexpected local, regional or global events, such as war; acts of terrorism; financial, political or social disruptions; natural, environmental or man-made disasters; the spread of infectious illnesses or other public health issues (such as the global pandemic coronavirus disease 2020 (COVID-19)); and recessions and depressions could have a significant impact on the Fund and its investments and may impair market liquidity. Such events can cause investor fear, which can adversely affect the economies of nations, regions and the market in general, in ways that cannot necessarily be foreseen.
Models and Data Risk: The Fund’s investment exposure is heavily dependent on proprietary quantitative models as well as information and data supplied by third parties (“Models and Data”). When Models and Data prove to be incorrect or incomplete, any decisions made in reliance thereon may lead to securities being included in or excluded from the Fund’s portfolio that would have been excluded or included had the Models and Data been correct and complete. Some of the models used by the Fund are predictive in nature. The use of predictive models has inherent risks. For example, such models may incorrectly forecast future behavior, leading to potential losses. In addition, in unforeseen or certain low-probability scenarios (often involving a market disruption of some kind), such models may produce unexpected results, which can result in losses for the Fund.
Non-Diversification Risk: As a non-diversified fund, the Fund may invest more than 5% of its total assets in the securities of one or more issuers. The Fund also invests in underlying funds that are non-diversified. The Fund’s performance may be more sensitive to any single economic, business, political or regulatory occurrence than the value of shares of a diversified investment company.
Small and Mid-Capitalization Companies Risk: Investing in or having exposure to the securities of small-capitalization and mid-capitalization companies involves greater risks and the possibility of greater price volatility than investing in larger capitalization and more-established companies. Investments in mid-cap companies involve less risk than investing in smallcap companies. Smaller companies may have limited operating history, product lines, and financial resources, and the securities of these companies may lack sufficient market liquidity. Mid-cap companies often have narrower markets and more limited managerial and financial resources than larger, more established companies.
Turnover Risk: A higher portfolio turnover may result in higher transactional and brokerage costs. The Fund’s portfolio turnover rate may be significantly above 100% annually
Underlying Funds Risk: Investments in underlying funds involve duplication of investment advisory fees and certain other expenses. Each underlying fund is subject to specific risks, depending on the nature of its investment strategy. The manager of an underlying fund may not be successful in implementing its strategy. ETF shares may trade at a market price that may be lower (a discount) or higher (a premium) than the ETF’s net asset value. ETFs are also subject to brokerage and/or other trading costs, which could result in greater expenses to the Fund. Because the value of ETF shares depends on the demand in the market, the Adviser may not be able to liquidate the Fund’s holdings at the most optimal time, adversely affecting performance.
U.S. Government Securities Risk: The Fund may invest directly or indirectly in obligations issued by agencies and instrumentalities of the U.S. government. The U.S. government may choose not to provide financial support to U.S. government sponsored agencies or instrumentalities if it is not legally obligated to do so, in which case, if the issuer defaulted, the Fund might not be able to recover its investment.
Advisory services offered through Kensington Asset Management, LLC.