


by Craig Love, on December 22, 2023
Kensington Monthly Market Commentary: November 2023
Geopolitics: To the surprise of many, the geopolitical ramifications from the conflagration in Gaza (and, by extension, the Ukraine) have not extended to the energy complex, in fact quite the opposite. Oil and natural gas prices peaked in late October, which closely preceded the Hamas attack on Israel. Since then, oil prices have fallen over 26% peak to trough, driven by a number of factors: record level of production by the U.S., momentum-based speculators adding to short positions as price falls, falling demand in places like China and seasonal trends in oil markets themselves.
Geopolitical policy considerations may well be playing a role. Since Russia invaded the Ukraine in early 2022, U.S. oil production has increased by 2 mpd (million barrels per day).
US Oil Production (Million Barrels Per Day)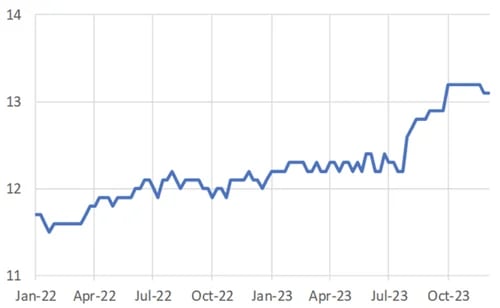 Source: X.com/jakluge (12/18/24)
The multi-week correction in oil prices has appeared to be beneficial in two respects: first, it has measurably reduced inflationary pressures in the economy and second, it has boosted disposable personal income among consumers, helping to increase overall aggregate demand outside of the oil sector.
The outlook for energy in the long run is uncertain, although oil consultant Rapidan Energy Group believes non-OPEC (“Organization of the Petroleum Exporting Countries”) supplies will increase by 700,000 barrels a day each year to 2030 — rather than the declines the consultant previously forecast — thanks to growth in the U.S., Guyana and Brazil.
Stock Market: The stock market experienced a strong price reversal in November, driven primarily by lower interest rates, associated easing financial conditions and higher global liquidity. The Nasdaq 100 led the way, gaining 10.67% by month’s end, while the S&P 500 Index rose 8.92% followed closely by the small-cap Russell 2000 which was up 8.83%. The market witnessed a significant broadening in leadership over the course of the month, which accelerated into December. This was a healthy sign overall of investor demand, and not surprisingly, resulted in a run to new highs (or close to) in the indices.
The economic backdrop to the rally harkened back to the 2010’s days of a goldilocks economy when inflation was subdued and GDP (“Gross Domestic Product”) numbers neither too hot nor too cold. Inflation numbers over the course of the year, while still above the Federal Reserve’s (“Fed”) long-term target of 2%, have continued to fall, labor tightness has shown meaningful signs of easing and Q4 GDP is downshifting gradually, all sufficient for markets to now anticipate a pause in Fed tightening, if not outright ease at some point in the coming year.
Focusing on the real economy and how hot it has been running, the U.S. Bureau of Economic Analysis recently revised their estimate of real Q3 GDP to a robust 5.2%. To show how unexpected this pace of growth was when estimates were first published, at the beginning of August 2023 the initial Blue Chip consensus of economic forecasters survey called for growth to essentially be flat. The widely tracked Atlanta Fed GDPNow model estimate was far more accurate (it predicted 3.5% growth at the time) but still underestimated the economy’s underlying strength. It’s hardly surprising then that Fed policy remained tight during the quarter. Tight monetary policy, in conjunction with a packed Treasury issuance calendar, could prove quite problematic for asset prices.
Turning to Q4 current growth expectations, the GDPNow model is forecasting still strong growth of 2.6%, but a substantial slowdown from Q3. The Blue Chip survey’s forecast is far lower, calling again for flat growth. The important takeaway is the economy is slowing measurably (but still growing) and that, combined with lower inflation, translates into a very positive backdrop for the stock market: a potential easing in Fed policy without jeopardizing overall corporate profitability.
Seasonally speaking, the market is tracking, if not exceeding, gains seen in the fourth quarter of the year of pre-election years.
Monthly Return Stats for the S&P 500 (1964-2022)
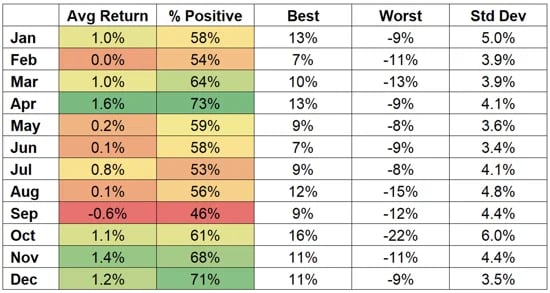 Source: Topdown Charts, Refinitiv (as of 12/31/2022)
This seasonal historical tendency combined with an extreme overweight in investor’s allocation to cash/equivalents argues for still higher prices ahead.
Chart 7: Allocation to Cash + T-Bills Highest Since Feb'10
BofA Private Client Cash + T-Bills % of AUM
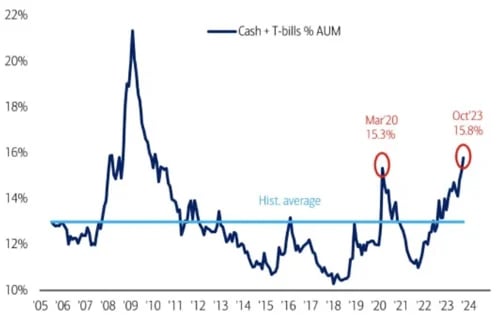
Source: BofA Global Investment Strategies (as of 10/31/2023)
All of these data points potentially set the stage for a rally of some magnitude, with the spark turning out to be Treasury Secretary Yellen’s announcement of a duration shift in their quarterly issue calendar toward more short-term maturities which relieved investors’ fear of higher interest rates at the long end of the yield curve.
Reinforcing a bullish outlook, the chart below shows the market has produced positive returns in 83% of election years going back a century. With Fed Liquidity – according to Michael Howell of Crossborder Capital, the aggregate measure of flows from the Central Bank into US money markets (and ultimately into banking system reserves) having risen by a whopping US $534 billion or 16.6% since the gilt debacle in September of last year, and fiscal stimulus still robust, the stock market may continue to rise barring an inflation surprise to the upside in the months ahead.
Exhibit 266: The S&P 500 Had Positive Returns in 83% of Election Years
S&P 500 Total Returns in Presidential Election Years
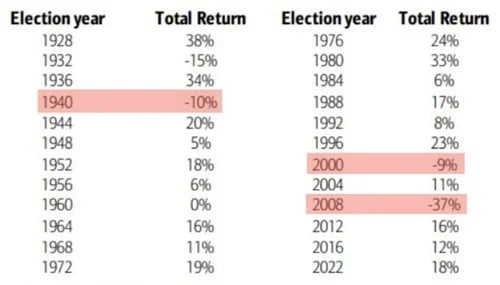
Source: Bloomberg. BofA US Equity & Quant Strategy (as of 12/31/2022)
Fixed Income: The combination of the Treasury’s deft handling of the quarterly refunding calendar, better than expected news on the inflation front and negative investor sentiment (contrary indicator) set the stage for an enormous rally in longer duration bonds. For the month, the 30-year Treasury returned 9.67%, the 10-year a more modest but still healthy 4.85%, and the Bloomberg U.S. Corporate Investment Grade Index, 5.98%. The more credit sensitive Bloomberg Corporate High Yield Index advanced as well, returning 4.53%.
The drop in the 30-year yield has been of historical proportion, peaking at 5.18% in late October before falling to 4% by mid-December. The fundamental underlying reasons lie in a softening labor market, coupled with favorable price trends (the personal consumption expenditure index, which includes food and energy, was flat for the month, the weakest reading since July 2022).
With regards to the employment outlook, the chart below provides an interesting seasonality perspective on unemployment claims:
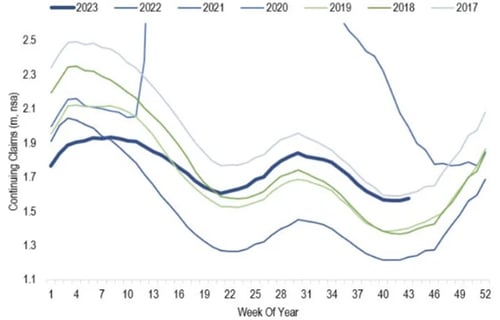
Source: US Department of Labor, Arch Global Economics (as of 10/31/2023)
Although the sample set is too small to draw definitive conclusions, recent history suggests we should expect claims to turn up meaningfully in the weeks ahead. Whether this trend, should it occur, is more long-lasting in nature and a harbinger of the long-predicted recession, is a story still to be told. One would be hard pressed, though, to bet on such an outcome in an election year.
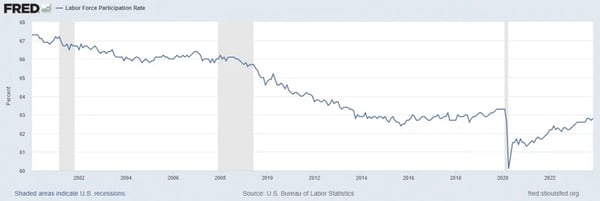
Federal Reserve and Monetary Policy: Perhaps the biggest story in 2023 will turn out to be the ability of Jerome Powell to engineer a broad decline in inflation without also inducing a hard landing in output and employment. While it’s too soon to declare “Mission Accomplished,” there is no question Chair Powell has successfully fulfilled his dual mandate of price stability and economic growth, at least for now.
A major part of the reason has been the substantial increase of people aged 25-64 who are working or seeking work. The pandemic caused a sudden fall in the civilian workforce which translated into a major drop in output. When the government stepped in to provide trillions of dollars in stimulus, the pandemic-induced reduction in supply was unable to meet the increased demand, leading to significant bottlenecks and price increases. While some of those supply problems still exist, the Federal Reserve now believes the influx of new workers is having a beneficial effect, increasing supply and in doing so, easing general price pressures in the economy. In the Fed’s eyes, risks have shifted, and the focus now is on economic growth and whether by keeping interest rates too high for too long it is jeopardizing the economy’s ability to maintain growth at its more desired moderate pace.
(as of 11/30/2023)
Managed Income Strategy
In early November, Managed Income moved back into a Risk-On position, investing in higher-yielding fixed income securities. This move was driven by a strengthening trend in US high yield corporate bonds, which began developing at the beginning of November. Across the fixed income spectrum, all bond segments exhibited a strong positive trend. With market participants believing the Federal Reserve is done raising rates in the short-run, the most-duration sensitive bonds outperformed during the month.
As we near the end of 2023, high yield trends remain favorable; therefore, we anticipate Managed Income will continue to participate in a Risk-On stance in the short term. Should economic conditions remain stable, we anticipate Managed Incomes' positioning will remain allocated to higher yielding fixed income.
Dynamic Growth Strategy
Dynamic Growth switched into a Risk-On posture at the beginning of November, driven by lowering volatility and broadening trends in the equity market. The Risk-On sentiment persisted throughout the month, as encouraging economic data pushed stocks higher. As a result, November 2023 was the best month for Dynamic Growth since July 2022. Should trends persist, we anticipate Dynamic Growth will remain in a “Risk-On” positioning as we near the end of the year.
Active Advantage Strategy
As with the other strategies, Active Advantage entered a full Risk-On stance in the beginning of November. This positioning is balanced, with approximately 60% across equities (both growth and core) and 40% in fixed income, including US high yield and investment grade corporates. Lower relative volatility and falling yields resulted in positive momentum for Active Advantage during the month. Going into December, as with the other strategies, we anticipate Active Advantage will remain fully invested should conditions point to strong sentiment and market breadth.
Defender Strategy
The Defender Strategy began the month of November with negative momentum in half of all the asset classes and maintained a Risk-Off positioning. However, there was a mid-month shift with increased momentum across several asset classes which signaled increased risk exposure. This increased risk exposure was highly beneficial for the 2nd half of the month as November represented one of the largest rallies across stocks and bonds in recent memory. After three consecutive negative months posted by stocks, the S&P 500 Index rose nearly 9% representing the 7th highest monthly return in over 30 years. Gains were also recognized across international equities as well, signaling some additional breadth in global markets. The options overlay on the portfolio was also in place for November and added to the overall performance for the month.
Definitions
S&P 500 Index: An American stock market index based on the market capitalizations of 500 large companies having common stock listed on the NYSE or NASDAQ.
NASDAQ 100 Index: An American stock market index based on the market capitalization of 100 largest companies on the NASDAQ.
Russell 2000 Index: An American stock market index based on the 2000 smallest capitalization companies in the Russell 3000 index.
Bloomberg Corporate Investment Grade Index: An unmanaged index that covers the publicly issued U.S. corporate and specified foreign debentures and secured notes that meet the specified maturity, liquidity, and quality requirements. To qualify, bonds must be SEC-registered.
Bloomberg US Corporate High Yield Index: An unmanaged market value-weighted index that covers the universe of fixed-rate, non-investment grade debt in the US. Securities are classified as high yield if the middle rating of Moody’s, Fitch and S&P is Ba1/BB+/BB+ or below. Bonds from issuers with an emerging markets country of risk, based on the indices’ EM country definition, are excluded.
Investing involves risk. Principal loss is possible.
Risks specific to the Managed Income Strategy include Management Risk, High-Yield Risk, Fixed-Income Security Risk, Foreign Investment Risk, Loans Risk, Market Risk, Underlying Funds Risk, Non-Diversification Risk, Turnover Risk, U.S. Government Securities Risk, Interest Rate Risk, Models and Data Risk.
Risks specific to the Dynamic Growth Strategy include Management Risk, Equity Securities Risk, Market Risk, Underlying Funds Risk, Non-Diversification Risk, Small and Mid-Capitalization Companies Risk, Turnover Risk, U.S. Government Securities Risk, Models and Data Risk.
Risks specific to the Active Advantage Strategy include Management Risk, Equity Securities Risk, High-Yield Risk, Fixed- Income Security Risk, Foreign Investment Risk, Loans Risk, Market Risk, Underlying Funds Risk, Limited History of Operations Risk, Non-Diversification Risk, Small and Mid-Capitalization Companies Risk, Turnover Risk, U.S. Government Securities Risk, Interest Rate Risk, Models and Data Risk.
Risks specific to the Defender Strategy include general market risk, credit risk, interest rate risk, management risk, equity securities risk, fixed-income securities risk, high-yield bond risk, foreign investment risk, emerging markets risk, real estate and REITs risk, commodities risk, currency risk, subsidiary risk, market risk, underlying funds risk, derivatives risk, limited history of operations risk, turnover risk, models and data risk, momentum risk or risk of the portfolio not performing as expected.
There is no guarantee that the investment objectives will be achieved. Moreover, the past performance is not a guarantee or indicator of future results. The investment return and principal value of an investment will fluctuate so that an investor’s shares, when redeemed, may be worth more or less than their original cost.
This is for informational purposes only and should not be construed as a solicitation to buy or sell, or to invest in any investment product or strategy. Investing in securities markets involves risk and the degree of risk varies by the type of investment or strategy. For a complete list of the risks associated with each of our Strategies, please review the Strategy Brochure and Factsheet. Materials such as blog posts, newsletters or commentary may contain information deemed to be correct and appropriate at a given time but may not reflect our current views or opinions due to changing market conditions. No information provided should be viewed as, or used as a substitute for individualized investment advice.
This document does not constitute advice or a recommendation or offer to sell or a solicitation to deal in any security or financial product. It is provided for information purposes only and on the understanding that the recipient has sufficient knowledge and experience to be able to understand and make their own evaluation of the proposals and services described herein, any risks associated therewith and any related legal, tax, accounting or other material considerations. To the extent that the reader has any questions regarding the applicability of any specific issue discussed above to their specific portfolio or situation, prospective investors are encouraged to contact the professional advisor of their choosing.
Certain information contained herein has been obtained from third party sources and such information has not been independently verified by Kensington Asset Management, LLC (“KAM”). No representation, warranty, or undertaking, expressed or implied, is given to the accuracy or completeness of such information by KAM or any other person. While such sources are believed to be reliable, KAM does not assume any responsibility for the accuracy or completeness of such information. KAM does not undertake any obligation to update the information contained herein as of any future date.
Any indices and other financial benchmarks shown are provided for illustrative purposes only, are unmanaged, reflect reinvestment of income and dividends and do not reflect the impact of advisory fees. Investors cannot invest directly in an index. Comparisons to indexes have limitations because indexes have volatility and other material characteristics that may differ from a particular strategy. For example, a strategy may typically hold substantially fewer securities than are contained in an index.
Certain information contained herein constitutes “forward-looking statements,” which can be identified by the use of forward-looking terminology such as “may,” “will,” “should,” “expect,” “anticipate,” “project,” “estimate,” “intend,” “continue,” or “believe,” or the negatives thereof or other variations thereon or comparable terminology. Due to various risks and uncertainties, actual events, results or actual performance may differ materially from those reflected or contemplated in such forward-looking statements. Nothing contained herein may be relied upon as a guarantee, promise, assurance or a representation as to the future.
Definitions:
Equity Securities Risk: The Fund may invest in or have exposure to equity securities. Equity securities may experience sudden, unpredictable drops in value or long periods of decline in value. This may occur because of factors that affect securities markets generally or factors affecting specific industries, sectors, geographic markets, or companies in which the Fund invests.
Fixed-Income Security Risk: The Fund may invest in or have exposure to fixed-income securities. Fixed-income securities are or may be subject to interest rate, credit, liquidity, prepayment and extension risks. Interest rates may go up resulting in a decrease in the value of fixed-income securities. Credit risk is the risk that an issuer will not make timely payments of principal and interest. There is also the risk that an issuer may “call,” or repay, its high yielding bonds before their maturity dates. Fixed-income securities subject to prepayment can offer less potential for gains during a declining interest rate environment and similar or greater potential for loss in a rising interest rate environment. Limited trading opportunities for certain fixed-income securities may make it more difficult to sell or buy a security at a favorable price or time. Changes in market conditions and government policies may lead to periods of heightened volatility and reduced liquidity in the fixedincome securities market, and could result in an increase in redemptions. Interest rate changes and their impact on a fund and its share price can be sudden and unpredictable.
Foreign Investment Risk: Foreign investments may be riskier than U.S. investments for many reasons, such as changes in currency exchange rates and unstable political, social, and economic conditions.
High-Yield Risk: Lower-quality fixed income securities, known as “high-yield” or “junk” bonds, present greater risk than bonds of higher quality, including an increased risk of default. These securities are considered speculative. Defaulted securities or those subject to a reorganization proceeding may become worthless and are illiquid.
LIBOR Risk: Changes related to the use of the London Interbank Offered Rate (LIBOR) or similar interbank offered rates (“IBORs,” such as the Euro Overnight Index Average (EONIA)) could have adverse impacts on financial instruments that reference LIBOR or a similar rate. While some instruments may contemplate a scenario where LIBOR or a similar rate is no longer available by providing for an alternative rate setting methodology, not all instruments have such fallback provisions and the effectiveness of replacement rates is uncertain. The abandonment of LIBOR and similar rates could affect the value and liquidity of instruments that reference such rates, especially those that do not have fallback provisions. The use of alternative reference rate products may impact investment strategy performance.
Limited History of Operations Risk: The Fund has a limited history of operations for investors to evaluate. The Fund may fail to attract sufficient assets to operate efficiently.
Loans Risk: The market for loans, including bank loans, loan participations, and syndicated loan assignments may not be highly liquid, and the holder may have difficulty selling them. These investments expose the Fund to the credit risk of both the financial institution and the underlying borrower. Bank loans settle on a delayed basis, which can be greater than seven days, potentially leading to the sale proceeds of such loans not being available for a substantial period of time after the sale of the bank loans.
Management Risk: The Adviser’s reliance on its proprietary trend-following model and the Adviser’s judgments about the attractiveness, value, and potential appreciation of particular assets may prove to be incorrect and may not produce the desired results.
Market Risk: Overall investment market risks affect the value of the Fund. Factors such as economic growth and market conditions, interest rate levels, and political events affect U.S. and international investment markets. Additionally, unexpected local, regional or global events, such as war; acts of terrorism; financial, political or social disruptions; natural, environmental or man-made disasters; the spread of infectious illnesses or other public health issues (such as the global pandemic coronavirus disease 2020 (COVID-19)); and recessions and depressions could have a significant impact on the Fund and its investments and may impair market liquidity. Such events can cause investor fear, which can adversely affect the economies of nations, regions and the market in general, in ways that cannot necessarily be foreseen.
Models and Data Risk: The Fund’s investment exposure is heavily dependent on proprietary quantitative models as well as information and data supplied by third parties (“Models and Data”). When Models and Data prove to be incorrect or incomplete, any decisions made in reliance thereon may lead to securities being included in or excluded from the Fund’s portfolio that would have been excluded or included had the Models and Data been correct and complete. Some of the models used by the Fund are predictive in nature. The use of predictive models has inherent risks. For example, such models may incorrectly forecast future behavior, leading to potential losses. In addition, in unforeseen or certain low-probability scenarios (often involving a market disruption of some kind), such models may produce unexpected results, which can result in losses for the Fund.
Non-Diversification Risk: As a non-diversified fund, the Fund may invest more than 5% of its total assets in the securities of one or more issuers. The Fund also invests in underlying funds that are non-diversified. The Fund’s performance may be more sensitive to any single economic, business, political or regulatory occurrence than the value of shares of a diversified investment company.
Small and Mid-Capitalization Companies Risk: Investing in or having exposure to the securities of small-capitalization and mid-capitalization companies involves greater risks and the possibility of greater price volatility than investing in larger capitalization and more-established companies. Investments in mid-cap companies involve less risk than investing in smallcap companies. Smaller companies may have limited operating history, product lines, and financial resources, and the securities of these companies may lack sufficient market liquidity. Mid-cap companies often have narrower markets and more limited managerial and financial resources than larger, more established companies.
Turnover Risk: A higher portfolio turnover may result in higher transactional and brokerage costs. The Fund’s portfolio turnover rate may be significantly above 100% annually
Underlying Funds Risk: Investments in underlying funds involve duplication of investment advisory fees and certain other expenses. Each underlying fund is subject to specific risks, depending on the nature of its investment strategy. The manager of an underlying fund may not be successful in implementing its strategy. ETF shares may trade at a market price that may be lower (a discount) or higher (a premium) than the ETF’s net asset value. ETFs are also subject to brokerage and/or other trading costs, which could result in greater expenses to the Fund. Because the value of ETF shares depends on the demand in the market, the Adviser may not be able to liquidate the Fund’s holdings at the most optimal time, adversely affecting performance.
U.S. Government Securities Risk: The Fund may invest directly or indirectly in obligations issued by agencies and instrumentalities of the U.S. government. The U.S. government may choose not to provide financial support to U.S. government sponsored agencies or instrumentalities if it is not legally obligated to do so, in which case, if the issuer defaulted, the Fund might not be able to recover its investment.